Excel Essentials
Excel Basics
What is Excel?
Think of Microsoft Excel as a digital piece of graph paper, but with a brain. It’s a spreadsheet program that lets you organize information in a grid of rows and columns. You can use it for just about anything that involves lists or numbers, from making a simple grocery list to tracking a business budget.
Its real power comes from its ability to perform calculations. Instead of manually adding up a column of numbers, you can tell Excel to do it for you. This makes it a go-to tool for managing data, analyzing information, and creating reports.
Finding Your Way Around
When you first open Excel, you'll see a big grid. This is your main workspace, called a worksheet. The worksheet is made of small boxes called cells, which are organized into numbered rows and lettered columns. Each cell has a unique address, like A1 or C5, based on its column and row.
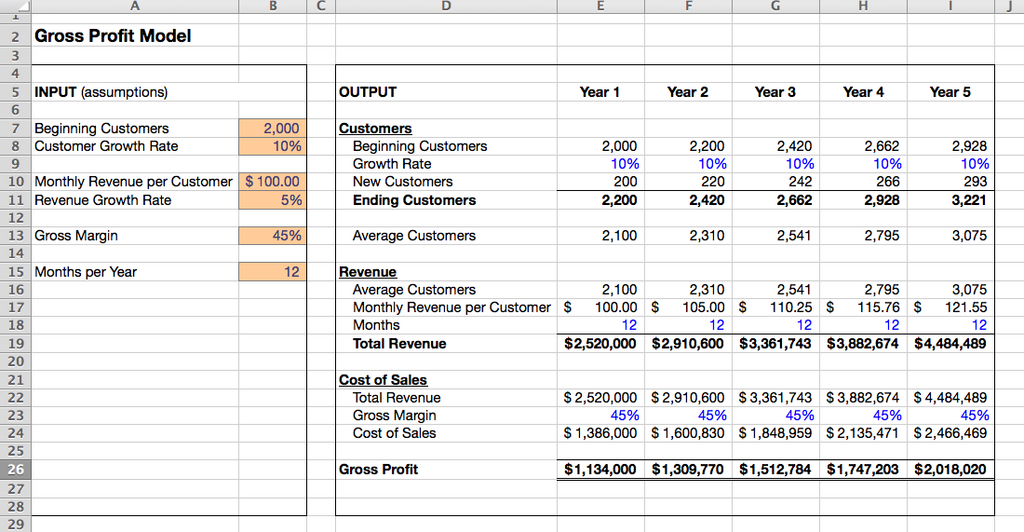
At the top of the screen is the Ribbon. This is where you'll find all of Excel's tools, grouped into tabs like Home, Insert, and Page Layout. The Home tab contains the most common commands you'll use for formatting and editing.
You can move from cell to cell by clicking with your mouse or using the arrow keys on your keyboard. Pressing
Entermoves you down one cell, whileTabmoves you one cell to the right.
Your First Spreadsheet
An entire Excel file is called a workbook. A workbook can hold one or more worksheets, which you can see as tabs at the bottom-left of the screen. Think of a workbook as a binder and worksheets as the individual pages inside it. You can add new sheets by clicking the + button, or right-click a sheet tab to rename it.
To enter data, just click a cell and start typing. You can input text, numbers, or dates. Excel is pretty smart about recognizing what you type. For example, if you enter 10/15/2024, it will understand that's a date.
When you're done creating your file, you can save it by going to File > Save As. Give your workbook a name and choose where to store it on your computer.
Making Data Readable
Raw data can be hard to read. Simple formatting helps your spreadsheet look clean and professional, making the information easier to understand at a glance. You'll find all the basic formatting tools in the Home tab on the Ribbon.
You can change the look of your text by making it bold or italic, or by changing the font color. To make certain cells stand out, you can change their background color using the Fill Color tool (it looks like a paint bucket). Adding borders is another great way to group related data together visually. Select the cells you want to format, and then click the Borders button to choose a style.
| Unformatted | January | February | March |
|---|---|---|---|
| Sales | 1500 | 1750 | 2100 |
| Expenses | 800 | 900 | 950 |
Now look at the same data with some simple formatting applied:
| Category | January | February | March |
|---|---|---|---|
| Sales | $1,500 | $1,750 | $2,100 |
| Expenses | $800 | $900 | $950 |
The second table is much easier to read. The headers are bolded, and the numbers are clearly marked as currency.
Ready to test your knowledge on the basics?
In Microsoft Excel, what is an entire file containing one or more worksheets called?
What is the unique address of a cell located at the intersection of column C and row 5?
You now know your way around the Excel interface and can create, save, and format a basic spreadsheet. These fundamental skills are the building blocks for everything else you'll do in Excel.