Excel Data Wrangling Mastery
Excel Basics
Getting Started with Excel
Microsoft Excel is a spreadsheet program. Think of it as a digital grid of cells, organized into rows and columns, designed to handle numbers, text, and formulas. This grid structure makes it incredibly powerful for organizing information, performing calculations, and even creating simple charts.
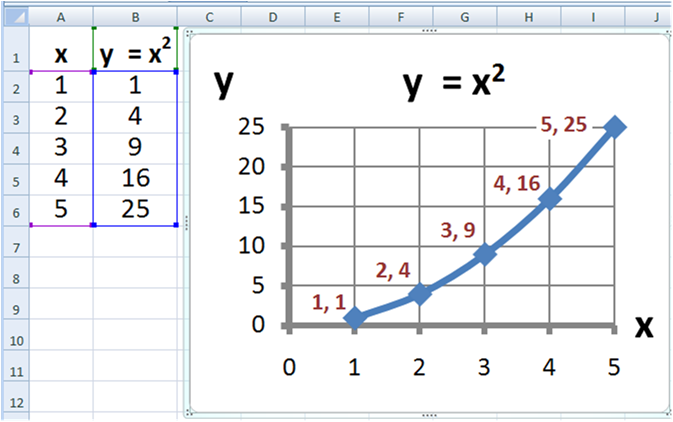
At its core, Excel helps you structure data. Each piece of information lives in a specific cell, identified by its column letter and row number, like A1, B2, or C3. This simple system is the foundation for everything else you can do in Excel, from tracking a budget to managing a complex project.
The Excel Interface
When you first open Excel, the grid of cells is the most prominent feature, but there are a few other key areas to know.
At the very top is the Ribbon. This is your main toolbar, organized into tabs like Home, Insert, and Data. Each tab contains groups of related commands.
Just below the Ribbon is the Formula Bar. This bar shows the actual content of the selected cell. If the cell contains a formula, you'll see the formula here, while the cell itself will show the result.
Each worksheet, or sheet, is a separate grid. You can switch between them using the tabs at the bottom-left of the window.
Understanding these elements is the first step. The real power of Excel comes from what you put inside the cells.
Formulas and Functions
Excel is more than a simple grid for text. You can perform calculations using formulas. Every formula in Excel starts with an equals sign (=). This tells Excel that the contents of the cell should be calculated.
For example, to add the numbers 5 and 10, you would type this into a cell:
=5+10
When you press Enter, the cell will display the result, 15. You can use standard arithmetic operators: + (addition), - (subtraction), * (multiplication), and / (division).
Better yet, you can perform calculations using the values in other cells. If you have the number 100 in cell A1 and 25 in cell A2, you can divide them by typing this formula into cell A3:
=A1/A2
Cell A3 will show the result, 4. The best part? If you change the value in A1 or A2, the result in A3 will update automatically.
Excel also has hundreds of built-in functions, which are preset formulas that simplify complex calculations. Functions have a name followed by parentheses, like SUM() or AVERAGE(). Inside the parentheses, you provide the arguments, which are the inputs for the function.
For example, to add up a column of numbers from cell B1 to B10, you don't need to type =B1+B2+B3.... Instead, you can use the SUM function:
=SUM(B1:B10)
The colon (:) creates a range, telling Excel to include all the cells from B1 through B10. Some other fundamental functions include:
AVERAGE(range): Calculates the average of the numbers in a range.MAX(range): Finds the largest value in a range.MIN(range): Finds the smallest value in a range.COUNT(range): Counts how many cells in the range contain numbers.
Mastering the basics is the essential first step toward learning advanced data analysis, including pivot tables, VLOOKUP, and macros.
Data Entry Best Practices
How you enter your data matters. Clean, consistent data is easier to work with later on. Follow a few simple rules to save yourself headaches.
First, keep your data organized in a table-like structure. Put column headers in the first row to describe the data in each column. For example, if you're tracking sales, your headers might be Date, Product, Quantity, and Price. Each new sale would then be a new row.
Second, be consistent. If you use an abbreviation for a state, like CA for California, use it every single time. Don't mix CA, Calif., and California in the same column. The same goes for capitalization and spelling. Consistency is key for sorting, filtering, and analyzing your data accurately.
Finally, put only one piece of information in each cell. Don't combine a city and a state in the same cell, like Los Angeles, CA. Instead, create separate columns for City and State. This makes your data much more flexible.
| Bad Example (A1) | Good Example (Column A & B) |
|---|---|
| New York, NY | City: New York State: NY |
| John Smith (Sales) | Name: John Smith Dept: Sales |
| 25 units | Quantity: 25 |
Following these simple guidelines will set you up for success. With a well-structured sheet and a basic understanding of formulas, you have a solid foundation for using Excel effectively.
In Microsoft Excel, which component displays the raw contents of the active cell, including any formulas?
Every formula in Excel must begin with which symbol?
These fundamentals are the building blocks for everything you'll do in Excel. Practice them, and you'll be ready to tackle more complex tasks.