Excel Dashboard Design
Data Preparation
Getting Your Data Ready
Before you can build a dashboard that tells a compelling story, you need to make sure your data is in good shape. Think of it like cooking. You wouldn't start making a complex dish with messy, disorganized ingredients. You wash the vegetables, measure the flour, and lay everything out neatly. Preparing your data is the same process. It's the most critical step, because a dashboard is only as good as the data it's built on.
The foundation of any dashboard is clean and well-organized data.
If your source data is messy, your dashboard will be unreliable. Taking the time to prepare your data properly ensures that the insights you uncover are accurate and trustworthy.
Structuring Your Data
Raw data often comes to us in a state that's easy for humans to read but difficult for Excel to analyze. It might have merged cells, extra titles, blank rows for spacing, or multiple pieces of information crammed into a single cell. For a dashboard to work, we need to convert this into a structured table.
A structured table in Excel follows simple rules: each row is a single record, and each column represents a specific attribute of that record. There are no blank rows or columns breaking up the data.
Every column needs a unique, descriptive header in the very first row. This tells Excel what kind of information is in that column. For example, instead of a generic "Date," use a more specific header like "Sale Date."
Let's look at an example. Here is some raw data about monthly sales.
| Q1 Sales Report | |||
|---|---|---|---|
| Salesperson | Month | Amount | |
| Alice | Jan | $1,200 | |
| Bob | Jan | $950 | |
| Alice | Feb | $1,500 | |
| Bob | Feb | $1,100 |
This format has issues. There's a main title, a blank row, and merged cells are implied. It's not ready for analysis. We need to restructure it into a proper data table, like this:
| Salesperson | Month | Sale Amount |
|---|---|---|
| Alice | Jan | 1200 |
| Bob | Jan | 950 |
| Alice | Feb | 1500 |
| Bob | Feb | 1100 |
This revised format is clean and structured. Every row is a complete record of a sale, and each column contains one type of information. Now Excel can easily sort, filter, and summarize this data for a dashboard.
Cleaning Up the Mess
Once your data is in a structured table, the next step is to clean it. Data cleaning is the process of fixing or removing incorrect, corrupted, or duplicate data within your dataset. It ensures your analysis is built on a foundation of quality and consistency.
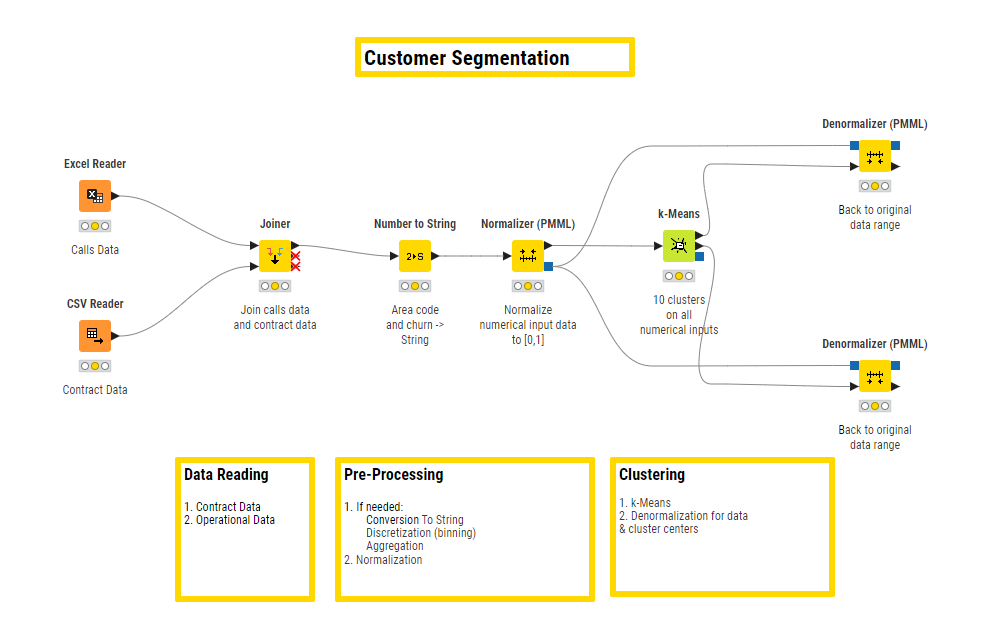
Common cleaning tasks in Excel include:
- Removing Duplicates: Sometimes, the same record appears more than once. Excel's "Remove Duplicates" tool can find and delete these extra rows instantly.
- Fixing Inconsistencies: A classic example is having state names entered differently, like "CA," "Calif.," and "California." You need to standardize these to a single format. The "Find and Replace" feature is perfect for this.
- Handling Blanks: Empty cells can cause errors in calculations. You must decide how to handle them. Should they be filled with a zero, a specific text like "Unknown," or should the entire row be removed?
- Trimming Extra Spaces: Data imported from other systems can sometimes have leading or trailing spaces that are hard to see. These can prevent Excel from recognizing that "Apple " is the same as "Apple".
- Correcting Data Types: Ensure all data in a column is the same type. A column for sales amounts shouldn't contain text like "N/A." These should be converted to numbers, like 0, to allow for mathematical operations.
Clean, consistent data is the goal. Every cleaning action you take improves the reliability of your final dashboard.
Taking these steps to structure and clean your data will save you countless headaches later. With a solid data foundation, you're ready to start visualizing your insights.