EKG Interpretation Fundamentals
EKG Basics
The Heart's Electrical Symphony
Your heart beats because of a tiny, perfectly timed electrical signal. This signal tells your heart muscle when to contract and pump blood. An electrocardiogram, or EKG, is a test that listens to and records this electrical activity. Think of it as eavesdropping on the conversation happening inside your heart.
The whole process starts in a specialized group of cells called the sinoatrial (SA) node, located in the heart's upper right chamber (the right atrium). The SA node is the heart's natural pacemaker. It spontaneously generates an electrical impulse that kicks off each heartbeat.
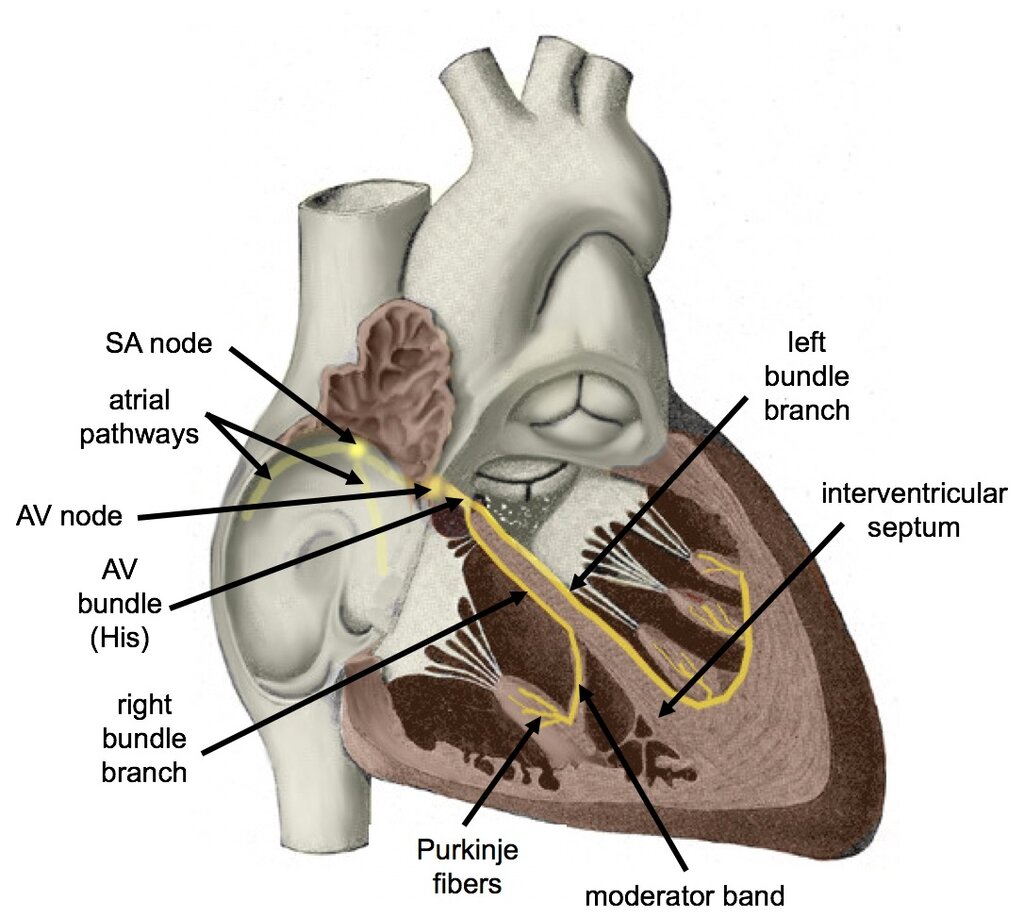
From the SA node, the impulse spreads across both atria, causing them to contract and push blood into the lower chambers (the ventricles). The signal then travels to the atrioventricular (AV) node, which acts like a gatekeeper. It briefly pauses the signal, giving the ventricles enough time to fill with blood.
After the pause, the signal zips down a pathway called the AV bundle (or Bundle of His), which splits into right and left bundle branches. These branches carry the signal to the walls of the ventricles. Finally, the impulse spreads through a network of Purkinje fibers, triggering the powerful contraction of the ventricles that sends blood out to your lungs and the rest of your body.
From Signal to Waveform
This wave of electrical activity is created by the movement of charged particles, or ions, across the membranes of heart muscle cells. The process of electrical activation is called depolarization, and the return to a resting state is called repolarization. An EKG machine detects these changes in electricity using electrodes placed on the skin.
The EKG machine translates this electrical information into a tracing of lines and waves. A single, normal heartbeat produces a characteristic pattern with three main parts.
P wave: Represents the depolarization of the atria. QRS complex: Represents the depolarization of the ventricles. Atrial repolarization also happens during this time, but it's hidden by the much larger ventricular signal. T wave: Represents the repolarization of the ventricles.
Getting a Complete Picture
To get a comprehensive view of the heart's electrical activity, clinicians use a standard 12-lead EKG. This doesn't mean 12 electrodes are used; it actually involves 10 electrodes placed on the patient's limbs and chest. These electrodes create 12 different electrical "views" of the heart from various angles.
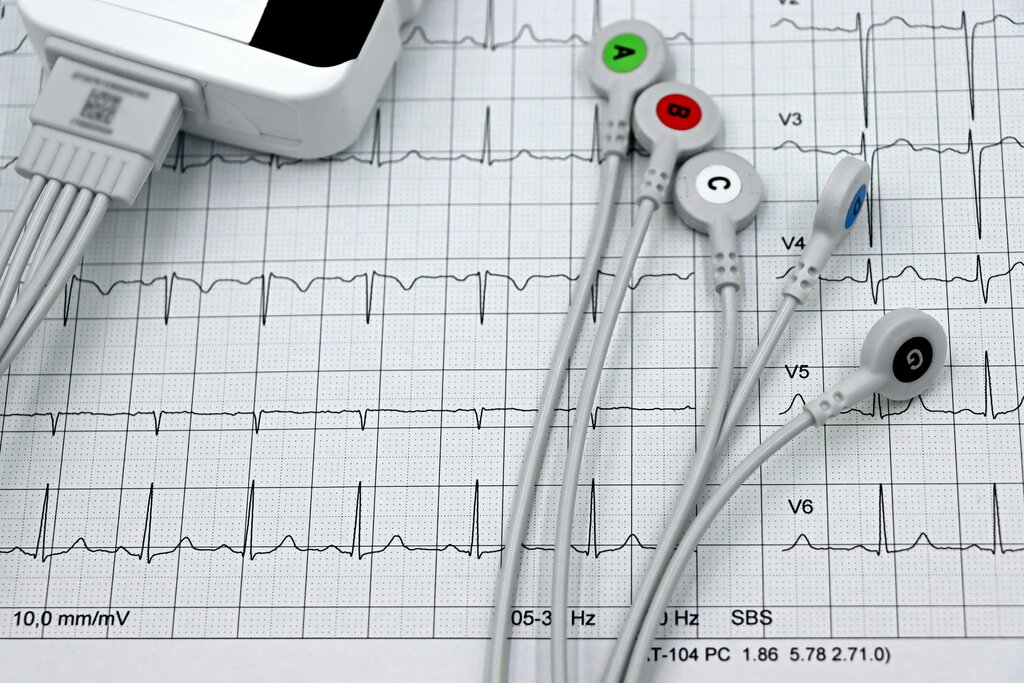
Each lead provides a unique snapshot of the depolarization and repolarization waves as they move through the heart. By looking at all 12 leads together, a doctor can pinpoint the location and nature of many heart problems. For now, the key takeaway is that each wave on an EKG corresponds to a specific electrical event in the cardiac cycle.
Let's check your understanding of these fundamental concepts.
What is considered the heart's natural pacemaker?
An electrocardiogram (EKG) directly measures the _______ of the heart.
By understanding this basic sequence—from the SA node's spark to the resulting waves on the EKG—you have the foundation needed to begin interpreting these vital tracings.