EKG Interpretation for Medical Residents
EKG Basics
The Heart’s Electrical System
Think of the heart's conduction system as the wiring that powers a coordinated, rhythmic pump. It all starts with a natural pacemaker, a tiny cluster of cells called the sinoatrial (SA) node, located in the right atrium. The SA node spontaneously generates an electrical impulse, setting the pace for the entire heart.
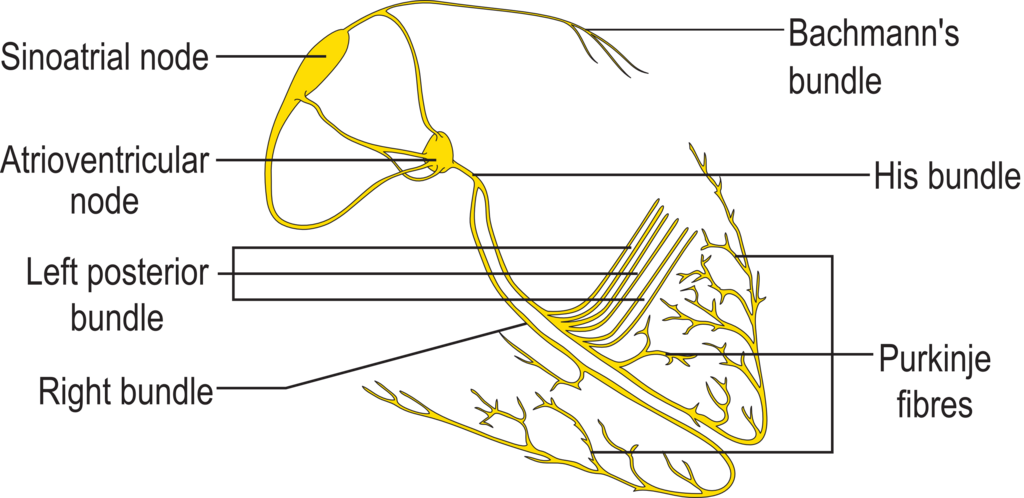
This impulse first spreads across both atria, causing them to contract and push blood into the ventricles. The signal then travels to the atrioventricular (AV) node, which acts like a gatekeeper. It briefly delays the impulse, giving the ventricles enough time to fill with blood before they contract.
From the AV node, the signal zips down the Bundle of His, which divides into the right and left bundle branches. These branches carry the impulse through the ventricular septum. Finally, the signal spreads into the Purkinje fibers, a network of pathways that rapidly distribute the impulse throughout the ventricular walls, triggering a powerful, synchronized contraction that pumps blood to the lungs and the rest of the body.
Capturing the Signal
An electrocardiogram, or EKG, is a recording of this electrical activity. By placing electrodes on the skin, we can detect these tiny electrical changes and display them as a graph. A standard EKG uses 10 electrodes to generate 12 different views, or "leads," of the heart's electrical field. It’s like having 12 cameras positioned around the heart, each providing a unique perspective.
Depolarization
noun
The process during which a cell, like a heart muscle cell, undergoes a shift in electric charge distribution, resulting in less negative charge inside the cell. This event initiates contraction.
These 12 leads are divided into two main groups:
- Limb Leads: Six leads that view the heart in a vertical plane (the frontal plane). These include leads I, II, III, aVR, aVL, and aVF. They are derived from electrodes placed on the arms and legs.
- Precordial (Chest) Leads: Six leads that view the heart in a horizontal plane (the transverse plane). These are leads V1 through V6, derived from electrodes placed directly on the chest.
Together, these 12 views give us a three-dimensional picture of the heart's electrical activity, allowing us to pinpoint where an electrical event is occurring.
Decoding the Waveform
Each heartbeat produces a predictable series of waves on the EKG. Understanding these components is the first step to interpretation. A single cardiac cycle consists of a P wave, a QRS complex, and a T wave.
P wave: The first small, upward bump. It represents atrial depolarization, the wave of electricity that causes the atria to contract.
QRS complex: The large, spiked portion. This represents ventricular depolarization. Because the ventricles are much larger than the atria, this signal is much stronger. Atrial repolarization (the recovery phase) also happens during this time, but it's obscured by the powerful QRS signal.
T wave: The modest, rounded wave that follows the QRS complex. It represents ventricular repolarization, when the ventricles electrically reset for the next beat.
U wave: A small, additional wave that sometimes appears after the T wave. Its origin is not fully understood, but it may represent the repolarization of the Purkinje fibers. It is often not visible.
A simple way to remember the sequence: The P wave shows the atria contracting, the QRS shows the ventricles contracting, and the T wave shows the ventricles relaxing.
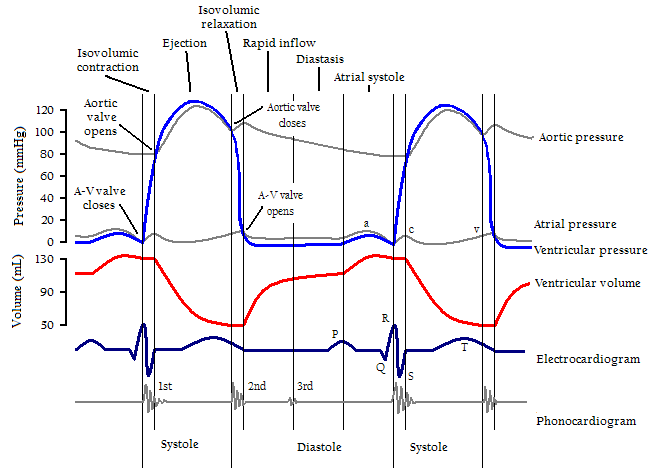
By analyzing the shape, size, and timing of these waves and the intervals between them across all 12 leads, we can diagnose a huge range of cardiac conditions. But it all starts with mastering these fundamentals. Let's see what you've learned.
Which structure is considered the heart's natural pacemaker, initiating the electrical impulse for a normal heartbeat?
What is the primary function of the brief delay at the atrioventricular (AV) node?
A solid grasp of the heart's electrical system and its representation on an EKG is the foundation for all further interpretation skills.