Dynamics of the Human Circulatory System
Cardiac Cycle Mechanics
The Heart as a Pump
The heart's electrical system may provide the spark, but the mechanical squeeze is what moves the blood. This coordinated sequence of contraction (systole) and relaxation (diastole) is the cardiac cycle. It’s not just a simple on-off switch; it’s a precisely timed dance of pressure and volume changes that ensures blood flows in one direction, efficiently and continuously.
Think of it in two main phases. During diastole, the heart's chambers relax and fill with blood. During systole, they contract and pump that blood out. The atria and ventricles have their own systole and diastole phases, and their timing is critical. Atrial systole gives the ventricles a final top-off of blood just before the ventricles begin their own powerful contraction.
Mapping the Cycle
To truly appreciate the heart's mechanics, we need to see how all its moving parts relate to one another over time. In the early 20th century, a physician named Carl J. Wiggers did just that. He developed a comprehensive graph that overlays all the key events of the cardiac cycle onto a single timeline. This is still a cornerstone of cardiovascular physiology.
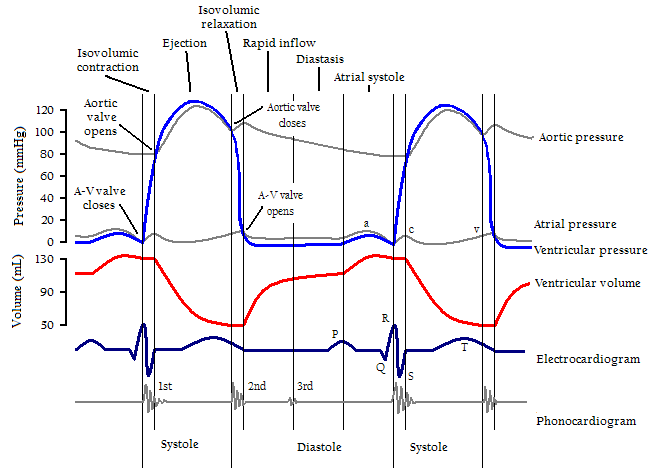
The diagram tracks several things at once:
- Aortic Pressure: The pressure inside the major artery leaving the left ventricle.
- Ventricular Pressure: The pressure inside the left ventricle itself.
- Atrial Pressure: The pressure inside the left atrium.
- Ventricular Volume: How much blood is in the left ventricle.
- Electrocardiogram (ECG): The heart's electrical activity.
- Heart Sounds: The 'lub-dub' sounds created by valve closures.
By following these lines, you can see exactly when valves open and close. For example, the mitral valve closes when ventricular pressure exceeds atrial pressure. The aortic valve opens only when ventricular pressure climbs higher than the pressure in the aorta.
Notice the small notch in the aortic pressure wave, called the dicrotic notch. It marks the brief backflow of blood just before the aortic valve snaps shut.
Pressure vs. Volume
While the Wiggers Diagram is great for timing, another tool, the pressure-volume loop, is perfect for understanding the heart's efficiency as a pump. This graph plots left ventricular pressure against left ventricular volume through one complete cardiac cycle, creating a loop.
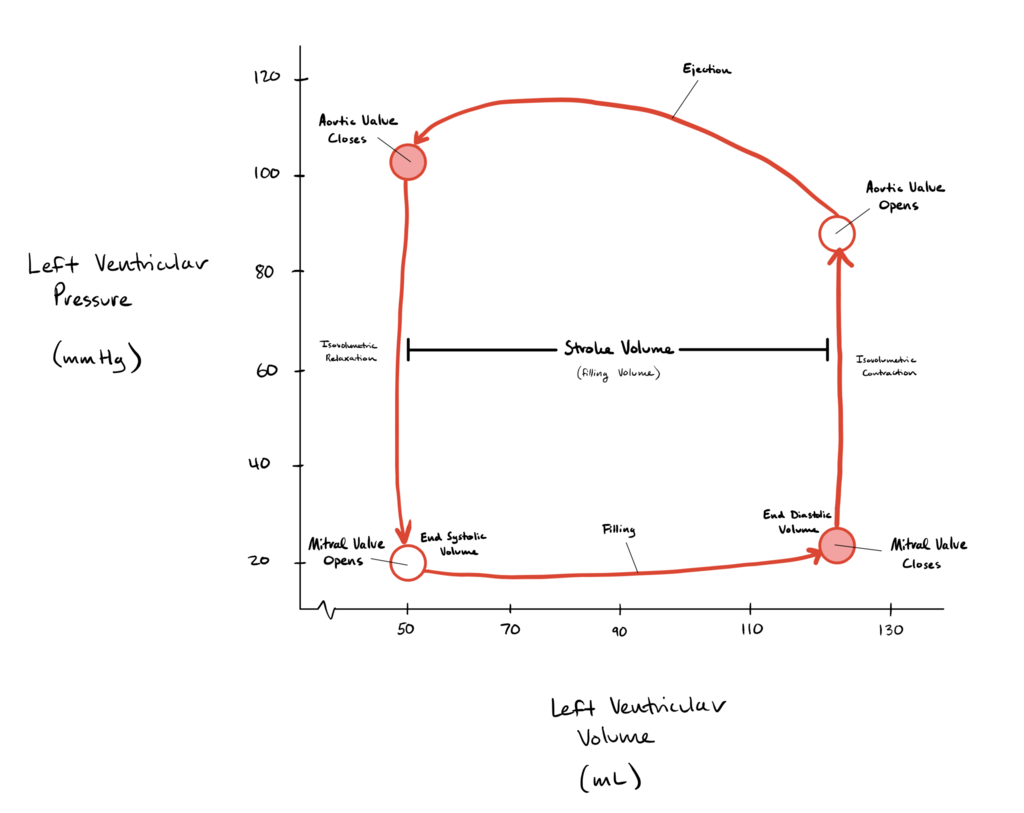
The loop has four distinct phases:
- Filling: The mitral valve is open, and the ventricle relaxes and fills with blood from the atrium. Volume increases, but pressure stays low.
- : The mitral valve closes. For a brief moment, both the mitral and aortic valves are shut. The ventricle contracts, causing a sharp rise in pressure, but the volume of blood inside doesn't change.
- Ejection: Once ventricular pressure exceeds aortic pressure, the aortic valve opens. The ventricle continues to contract, forcing blood into the aorta. Volume decreases as pressure first rises and then falls.
- Isovolumetric Relaxation: The aortic valve closes. Again, both valves are shut. The ventricle relaxes, pressure plummets, but the volume remains constant at its minimum level before filling begins again.
The cardiovascular system isn't just anatomy to memorize—it's a pressure-driven fluid transport network that engineers analyze using the same principles applied to pumps, pipes, and hydraulic systems.
The width of the loop represents the stroke volume—the amount of blood pumped with each beat. The total area inside the loop represents the work done by the ventricle during that beat. This is how cardiologists can quantify the heart's performance and diagnose problems. For instance, in heart failure, the loop might become smaller and shift to the right, indicating the ventricle is doing less work and handling larger volumes of blood inefficiently.
Time to test your understanding of the heart's mechanical cycle.
What are the two main, overarching phases of the cardiac cycle?
According to the principles illustrated in the Wiggers Diagram, what event triggers the opening of the aortic valve?
Understanding the interplay of pressure, volume, and timing is key to grasping how this remarkable organ sustains life, beat after beat.