Dynamics of the Human Circulatory System
Advanced Cardiac Cycle
The Heart's Mechanical Dance
The familiar “lub-dub” of a heartbeat is just the soundtrack to a complex mechanical and electrical performance. To truly understand how the heart works as a pump, we need to look beyond the simple flow of blood and examine the interplay of pressure, volume, and timing within its chambers. This is the cardiac cycle, a sequence where every event is precisely synchronized.
Think of it less like a simple on-off switch and more like the coordinated cycle of an engine. There are intake strokes, compression strokes, power strokes, and exhaust strokes, all timed perfectly to maximize efficiency. In the heart, these phases ensure that blood is moved with the right amount of force at exactly the right moment.
Visualizing the Cycle
It's one thing to talk about these events, but another to see them all happen at once. For that, cardiologists and physiologists turn to the an ingenious chart that stacks multiple graphs on a shared timeline. It simultaneously displays the heart's electrical activity (ECG), the pressure changes in the atria, ventricles, and aorta, ventricular volume, and the resulting .
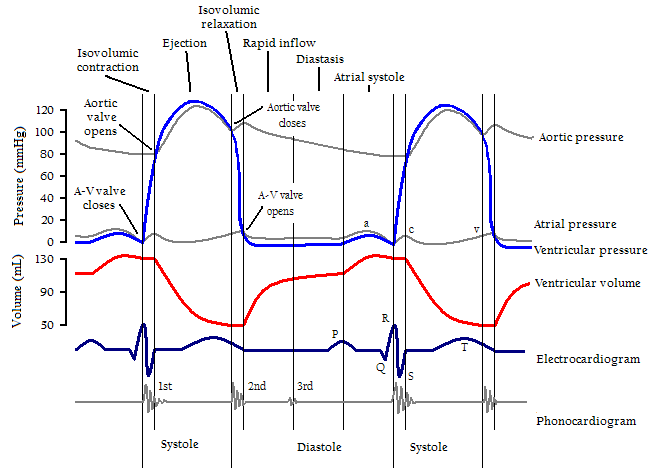
Let’s trace the main events. The cycle's pacemaker is the electrical signal shown on the electrocardiogram (ECG). The P wave represents atrial depolarization, which triggers the atria to contract. This contraction, often called the , gives the ventricles a final top-off of blood before they begin their own powerful squeeze. This accounts for the last 10-20% of ventricular filling.
Shortly after the QRS complex appears on the ECG, signaling ventricular depolarization, the ventricles begin to contract. This marks the start of systole, the heart's contraction phase.
Building Pressure
The moment the ventricles start contracting, the pressure inside them rises sharply. This pressure immediately pushes the mitral and tricuspid valves shut, preventing blood from flowing backward into the atria. This valve closure produces the first heart sound (S1).
For a brief, critical moment, the ventricles are contracting, but both the inlet (AV) and outlet (semilunar) valves are closed. This is isovolumetric contraction.
During this phase, the volume of blood inside the ventricle doesn't change, but the muscle tension builds rapidly, like squeezing a sealed water balloon. The pressure skyrockets until it exceeds the pressure in the aorta and pulmonary artery. Once that threshold is crossed, the aortic and pulmonary valves are forced open, and the ejection phase begins, sending blood surging into the body and lungs.
Following the T wave of the ECG, which signals ventricular repolarization, the ventricles begin to relax. This is the start of diastole. As they relax, ventricular pressure falls rapidly. When it drops below the pressure in the aorta and pulmonary artery, blood tries to flow backward, but this back-pressure snaps the semilunar valves shut. This closure creates the second heart sound (S2).
Just like before, there's a moment when all four valves are closed again. This is isovolumetric relaxation. The ventricular muscle is relaxing, pressure is plummeting, but the volume of blood inside isn't changing yet.
This continues until the ventricular pressure drops below the atrial pressure. At that point, the mitral and tricuspid valves drift open, and the ventricles begin passively filling with blood for the next cycle.
The Pressure-Volume Loop
While the Wiggers diagram shows events over time, a pressure-volume loop offers a different perspective. It plots left ventricular pressure against left ventricular volume through one complete cardiac cycle, creating a tidy, counter-clockwise loop. This graph is incredibly powerful for assessing the heart's mechanical performance and efficiency.
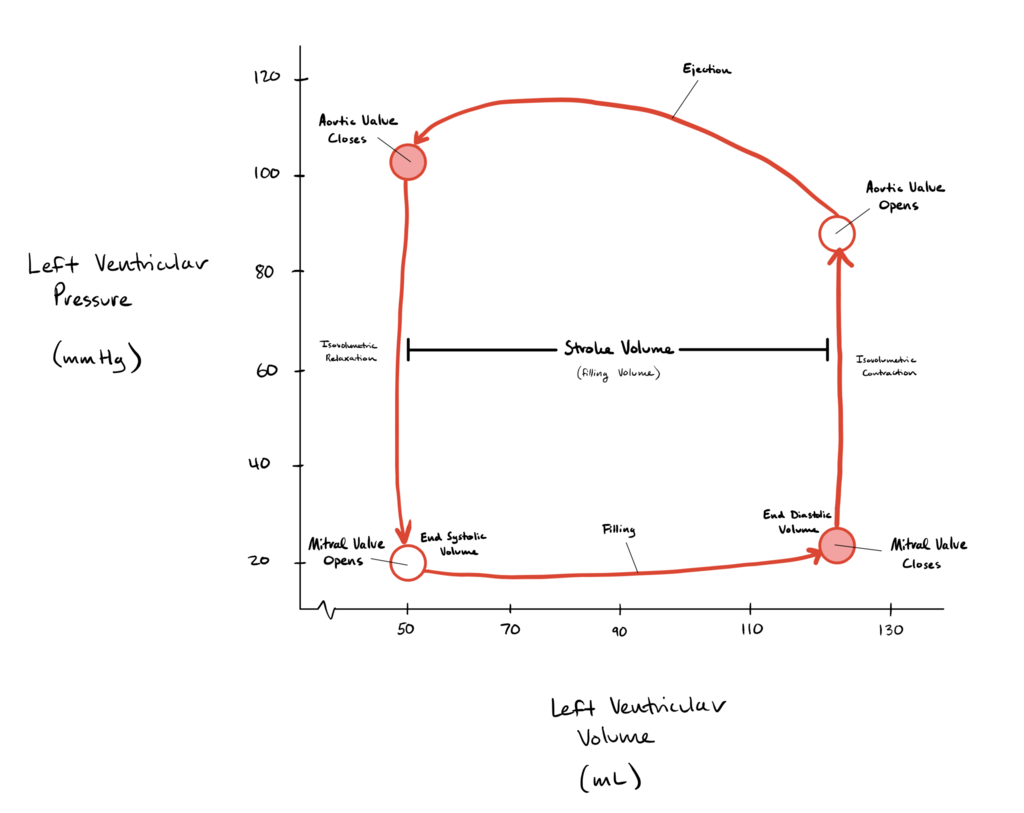
The loop can be read in four distinct phases:
- Filling: The bottom line shows the ventricle filling at low pressure. The volume increases as the mitral valve is open.
- Isovolumetric Contraction: The vertical line on the right shows pressure shooting up with no change in volume. Both valves are closed.
- Ejection: The top curve shows the ventricle ejecting blood. Volume decreases as pressure first rises and then falls. The aortic valve is open.
- Isovolumetric Relaxation: The vertical line on the left shows pressure dropping dramatically with no change in volume. Both valves are closed again, returning to the starting point.
The width of the loop represents the stroke volume—the amount of blood pumped per beat. The area inside the loop represents the work done by the ventricle in a single cycle.
Now, let's test your understanding of these synchronized events.
What is the primary purpose of the Wiggers diagram in cardiology?
The first heart sound (S1), the "lub," is caused by which event in the cardiac cycle?
Understanding these mechanical phases provides the foundation for analyzing how the heart adapts to stress, disease, and exercise. It's the engine's internal mechanics, which ultimately determine the performance of the entire circulatory system.