Drone Multispectral Imaging for Crop Health
Electromagnetic Spectrum and Vegetation Interaction
Light Beyond What We See
Our eyes are great at seeing the world, but they only pick up on a tiny sliver of the light that’s all around us. This light is part of the electromagnetic spectrum, a huge range of energy that travels in waves. Think of it like a massive piano keyboard. The visible light we see—all the colors of the rainbow—is just one octave in the middle. To one side, you have lower-energy waves like radio waves and microwaves. To the other, you have high-energy waves like ultraviolet (UV) light and X-rays.
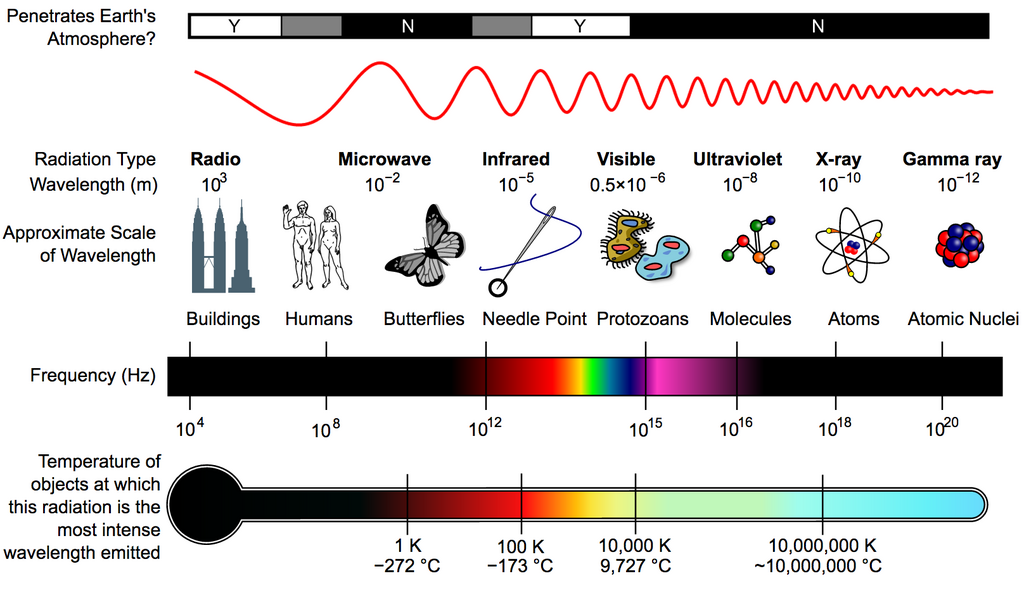
Every type of wave on this spectrum carries information. By using special sensors, we can “see” these other forms of light and learn things that are invisible to our naked eyes. This is especially useful when looking at plants.
How Plants Use Light
Plants are masters of using light. Their survival depends on absorbing energy from the sun to create food through photosynthesis. The key player in this process is a pigment called chlorophyll, which is what makes plants green.
Chlorophyll is very good at absorbing light from the red and blue parts of the visible spectrum. It uses the energy from this light to power photosynthesis. But what about green light? Chlorophyll doesn't absorb it very well. Instead, it reflects it, which is why healthy leaves look green to us.
Something even more interesting happens in a part of the spectrum we can't see: near-infrared (NIR). While chlorophyll handles visible light, the internal cell structure of a healthy leaf—the spongy, air-filled layers where gases are exchanged—is excellent at reflecting NIR light.
A stressed or unhealthy plant has a different signature. If a plant is dehydrated or sick, its internal cell structure can break down. This causes it to reflect less NIR light. At the same time, a reduction in chlorophyll means it will absorb less red light and reflect more of it.
Healthy vegetation absorbs red light and strongly reflects near-infrared light. This simple rule is the foundation of remote crop monitoring.
Reading the Spectral Bands
To measure these differences precisely, scientists and farmers use sensors that focus on specific slices of the electromagnetic spectrum called spectral bands. For plant health, a few bands are especially important.
| Spectral Band | What it Tells Us About Plants |
|---|---|
| Red | Measures chlorophyll absorption. Low reflectance means the plant is photosynthesizing well. |
| Green | Measures chlorophyll reflection. This is what makes healthy plants look green to our eyes. |
| Blue | Also used for photosynthesis, but less commonly used for health monitoring than the red band. |
| Near-Infrared (NIR) | Measures light reflected by a leaf's cellular structure. High reflectance indicates healthy, dense cell structure. |
By comparing the amount of light reflected in these different bands, we can calculate various vegetation indices. These are simple formulas that turn spectral data into a single, easy-to-understand number that often corresponds directly to plant health, density, or stress. Drones and satellites equipped with multispectral sensors capture this data from above, allowing for a detailed look at every part of a field without ever setting foot in it.
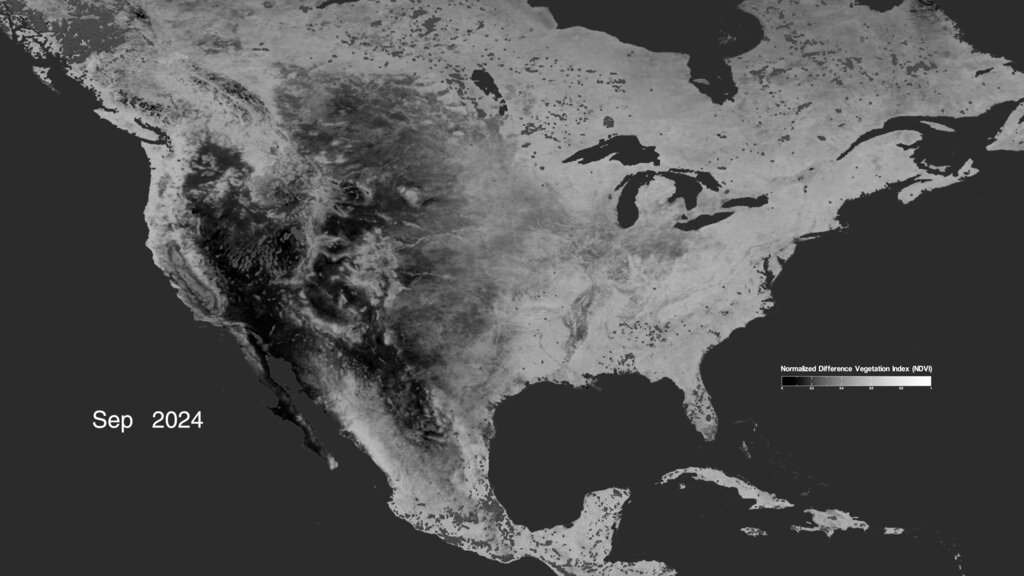
Let's check your understanding of how light and plants interact.
Why do healthy plants appear green to our eyes?
A remote sensor detects that a patch of forest is reflecting significantly less near-infrared (NIR) light than it did a month ago. What is a likely explanation?
Understanding these basic principles is the first step in using advanced tools to monitor agriculture. By analyzing how plants interact with different kinds of light, we can gain powerful insights into their health.