Demystifying the B Value in Linear Regression
Linear Regression Basics
Finding the Pattern
Imagine you run an ice cream shop. You notice that on hotter days, you sell more ice cream. It seems obvious, but what if you wanted to predict exactly how much you'd sell based on the weather forecast? Linear regression is a tool that helps you do just that.
It's a statistical method for modeling the relationship between two variables. We use it to see if there's a straight-line connection between a dependent variable (the thing we want to predict, like ice cream sales) and an independent variable (the thing we think influences it, like temperature).
The goal is simple: draw the best possible straight line through a scatter of data points to make predictions.
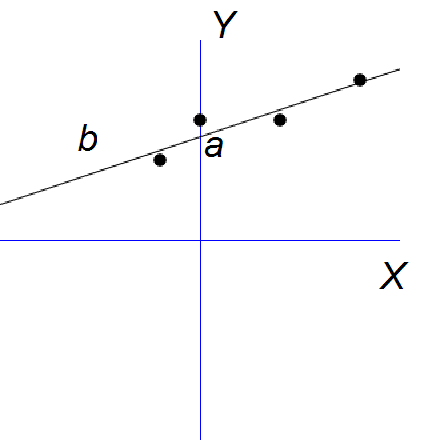
The Regression Equation
That straight line is described by a simple equation you might remember from algebra:
Let's break down what each part means in our ice cream example.
- Y is the dependent variable. It's what we're trying to predict. In this case, it's the daily ice cream sales.
- X is the independent variable. It's the information we're using to make the prediction, like the temperature in degrees.
- is the intercept. This is the value of Y when X is 0. It's where the line crosses the vertical y-axis. For our shop, it would be the predicted number of ice cream sales on a day with a temperature of 0 degrees. It’s our starting point.
- is the slope. This is the most important part for interpretation. It tells us how much Y changes for every one-unit increase in X.
If our slope () is 50, it means that for every 1-degree increase in temperature, we can expect to sell 50 more ice creams. If the slope were -50, it would mean we sell 50 fewer ice creams as it gets hotter, which would be very strange!
Rules of the Road
Linear regression is powerful, but it only works correctly if the data follows a few key rules, or assumptions. If your data violates these assumptions, your predictions might be inaccurate.
| Assumption | Meaning | Why It Matters |
|---|---|---|
| Linearity | The relationship between X and Y must be linear (a straight line, not a curve). | If the pattern is curved, a straight line won't be a good fit. |
| Independence | Each data point is independent of the others. | One day's sales shouldn't directly determine the next day's sales. |
| Homoscedasticity | The errors (the distance from the points to the line) are spread out evenly. | The model's accuracy shouldn't be better at low temperatures than high ones. |
| Normality of Errors | The errors are normally distributed (they form a bell curve). | This is important for making reliable statistical inferences from the model. |
Think of these assumptions as a checklist to run through before you trust your model's predictions. Violating them can lead you to draw the wrong conclusions.
Now that you understand the basic components and rules, let's test your knowledge.
In the ice cream shop example, where sales are predicted based on temperature, what is the independent variable?
What does the slope () in the linear regression equation represent?
By understanding the slope, intercept, and underlying assumptions, you have a solid foundation for interpreting and using linear regression models.