Demystifying P-values in Research
Introduction to Hypothesis Testing
Making an Educated Guess
How do scientists know if a new drug works? How do businesses decide if a new marketing campaign is effective? They can't just rely on a gut feeling. They need a structured way to make decisions using data. This process is called hypothesis testing.
Hypothesis testing is a formal procedure for investigating our ideas about the world using statistics. It's a way of testing a claim or hypothesis about a population parameter using data measured in a sample. Think of it as the scientific method for data analysis. You start with a theory, collect evidence, and then make a judgment about whether the evidence supports the theory.
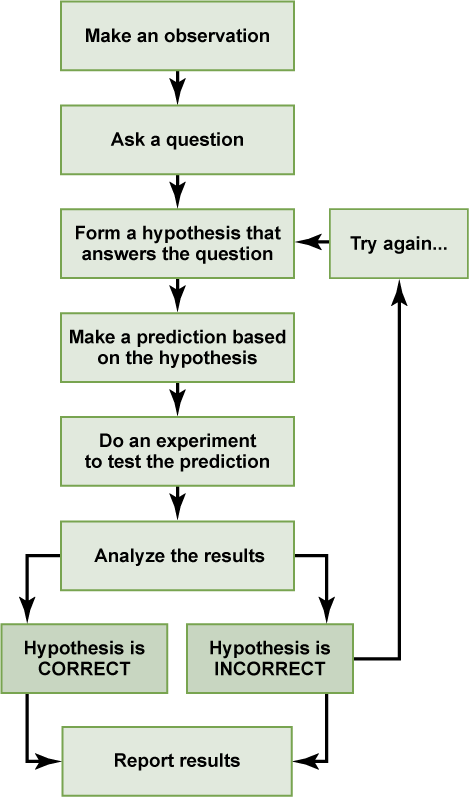
At its core, hypothesis testing helps us differentiate between real effects and random chance. If a new drug seems to lower cholesterol in a small group of patients, is that a real effect, or did those patients just happen to have their cholesterol go down by coincidence? Hypothesis testing gives us a framework to answer that question with a certain level of confidence.
The Two Competing Claims
Every hypothesis test starts with two competing statements about the world. These are the null hypothesis and the alternative hypothesis.
The null hypothesis () is the default assumption, the status quo. It usually states that there is no effect, no difference, or no relationship.
The alternative hypothesis ( or ) is what we are trying to find evidence for. It's the claim that there is an effect, a difference, or a relationship.
Imagine you're testing whether a new fertilizer increases crop yield. Your two hypotheses would be:
- Null Hypothesis (): The new fertilizer has no effect on crop yield. The average yield is the same as it's always been.
- Alternative Hypothesis (): The new fertilizer increases crop yield. The average yield is greater than it used to be.
The logic of hypothesis testing is a bit like a criminal trial. The defendant is presumed innocent until proven guilty. In our case, the null hypothesis is presumed to be true until the data provides enough evidence to prove it's not. Our goal isn't to prove the alternative hypothesis is true, but to see if we can gather enough evidence to reject the null hypothesis.
| Concept | Analogy in a Trial |
|---|---|
| Null Hypothesis () | Defendant is innocent |
| Alternative Hypothesis () | Defendant is guilty |
| Data/Evidence | Evidence presented in court |
| Rejecting | Verdict is "guilty" |
| Failing to reject | Verdict is "not guilty" |
From Data to Decision
Okay, so we have our hypotheses. Now what? We need a way to summarize our sample data into a single number that we can use to make a decision. This number is called a test statistic.
A test statistic measures how far our sample data deviates from what we would expect if the null hypothesis were true. There are many different types of test statistics, like the t-statistic, z-score, or chi-squared statistic, each used in different situations. But they all share the same basic idea: the further the test statistic is from zero, the more unusual our sample data is under the null hypothesis.
If the data is very different from what the null hypothesis predicts, our test statistic will be large. If the data is consistent with the null hypothesis, our test statistic will be small.
But how large is "large enough" to reject the null hypothesis? This is where the significance level comes in. The significance level, often denoted by the Greek letter alpha ("), is a threshold we set before we even collect data. It represents the probability of rejecting the null hypothesis when it's actually true, an error we want to avoid.
A common choice for is 0.05, or 5%. This means we're willing to accept a 5% chance of incorrectly rejecting the null hypothesis.
If our calculated test statistic falls into this "rejection region," it means our result is statistically significant. We have enough evidence to reject the null hypothesis in favor of the alternative. If the test statistic falls into the central region, we fail to reject the null hypothesis. This doesn't mean the null is true, just that we don't have enough evidence to say it's false.
Time to check your understanding of these core concepts.
What is the primary purpose of hypothesis testing in statistics?
A researcher wants to test if a new teaching method improves student test scores. What would be the appropriate null hypothesis () for this study?
Understanding these building blocks—the null and alternative hypotheses, test statistics, and decision rules—is the first step in using data to make informed decisions.