Demystifying Health Statistics and Headlines
Understanding Health Statistics
The Language of Health Data
Health statistics are the tools we use to understand the health of populations. They help us spot trends, test treatments, and make informed decisions about public health. Think of them as a way to turn vast amounts of health information into clear, actionable insights.
There are two main flavors of statistics you'll encounter.
Descriptive Statistics: These summarize the data you have. If you survey 100 people about their sleep, descriptive statistics would tell you their average hours of sleep or the most common sleep duration. It's a snapshot of that specific group.
Inferential Statistics: These use data from a small group (a sample) to make an educated guess about a much larger group (a population). Using our sleep survey, we could use inferential statistics to estimate the average sleep duration for the entire country, not just our 100 people.
Descriptive statistics tell you what is. Inferential statistics help you guess what's likely true for everyone.
Where Does Health Data Come From?
To analyze health, researchers first need data. They get it in a few key ways:
Observational Study
noun
A study where researchers observe subjects and measure variables of interest without assigning treatments. The goal is to find relationships between characteristics and health outcomes.
In an observational study, researchers are like detectives watching from a distance. They might follow a group of people for decades, recording their habits (like diet or exercise) and health outcomes (like heart disease) to see if patterns emerge. They don't intervene or tell anyone what to do.
Surveys are another common tool. Researchers ask a group of people questions to gather information on everything from their mental health to their access to medical care. The US Centers for Disease Control and Prevention (CDC) runs many national health surveys this way.
Clinical trials are different because they are experiments. To test a new drug, for example, researchers will give it to one group of people (the experimental group) and a placebo or existing treatment to another (the control group). By comparing the outcomes, they can determine if the new drug is safe and effective.
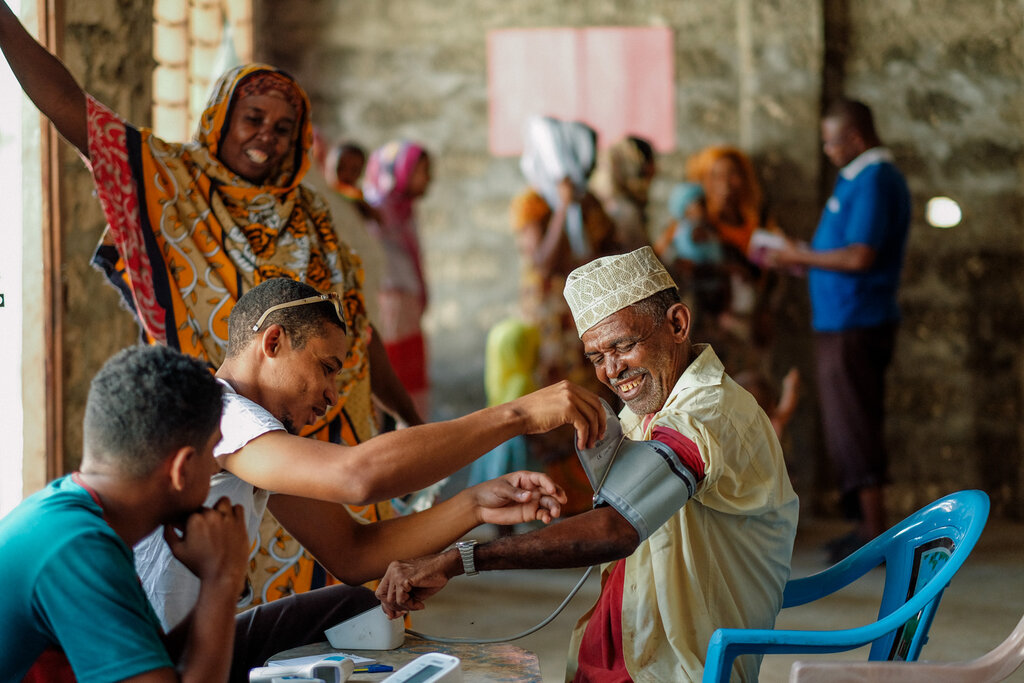
For any of these methods, the group being studied is called a sample. The goal is for this sample to be a miniature version of the larger population the researchers are interested in. A valid study on the health of American adults needs a sample that includes people of different ages, genders, ethnicities, and locations. A small or non-representative sample can lead to misleading conclusions.
Making Sense of the Numbers
Once data is collected, statisticians use specific measures to summarize it. You've likely seen these before.
The mean is the average value. Add up all the values and divide by the number of values. The median is the middle value when all the numbers are lined up in order. The mode is the value that appears most often.
Imagine the daily step counts for five people are 4000, 5000, 5000, 8000, and 15000. The mean is 7400 steps, the median is 5000, and the mode is 5000. The very active person with 15,000 steps pulls the mean up, which is why the median is often a better indicator of the 'typical' value when there are extreme outliers.
Beyond the center of the data, we also need to know how spread out it is. That's where standard deviation comes in. It measures the average distance of each data point from the mean. A low standard deviation means most people are very close to the average. A high one means the numbers are all over the place.
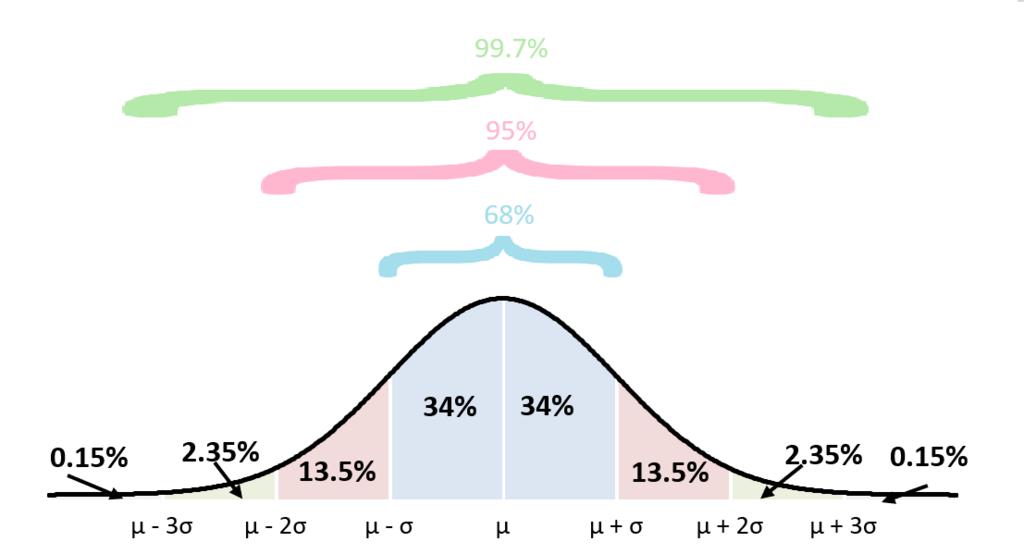
Finally, when researchers make an inference about a whole population, they often report a confidence interval. It's a range of values that they are fairly sure contains the true population value. For instance, instead of saying a new drug lowers blood pressure by exactly 10 points, they might say they are 95% confident it lowers it by 8 to 12 points. This range acknowledges the uncertainty that comes from studying a sample instead of the entire population.
A research team wants to test the effectiveness of a new cholesterol-lowering drug. They recruit 200 participants, giving half the new drug and the other half a placebo. What type of study is this?
Which of the following statements best describes inferential statistics?
These basic concepts are the building blocks for interpreting almost any health study you'll come across.