Demystifying Health Statistics
Understanding Medical Statistics
Making Sense of Medical Data
When you read about a new medical study or a health report, it's often filled with numbers and terms like "statistically significant" or "average risk." This is the language of biostatistics, the science of using data to understand health and biology. Far from being just academic, these concepts are how we determine if a new drug works, what factors contribute to a disease, and how to improve public health. Understanding the basics can help you sort fact from fiction and make better decisions about your own health.
Biostatistics is a vital tool in this effort.
Describing the Data
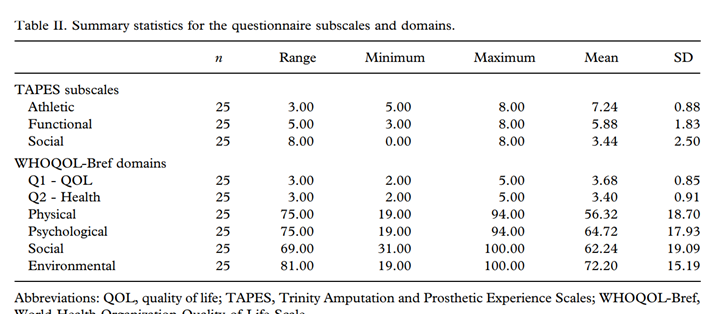
The first step in any analysis is to simply describe the data you have. This is the job of descriptive statistics. Think of it as creating a clear, concise summary of a large amount of information. Instead of looking at the individual blood pressure readings of 2,000 patients in a study, descriptive statistics can give you the average reading, the range from highest to lowest, and the most common reading.
This summary gives researchers a snapshot of their study group. Common descriptive measures include the mean (average), median (the middle value), and mode (the most frequent value). These tools help organize and present data in a way that's easy to understand.
mean
noun
The average of a set of numbers, calculated by adding all the values together and dividing by the count of values.
Making Predictions
Describing a group is useful, but medical research usually aims higher. Researchers want to draw conclusions that apply beyond just the people in their study. This is where inferential statistics comes in. It uses data from a small group, or a sample, to make an educated guess, or inference, about a much larger population.
For example, a clinical trial might test a new vaccine on 5,000 volunteers. The real question isn't just whether the vaccine worked for those 5,000 people, but whether it will work for the millions of people who might receive it in the future. Inferential statistics helps bridge that gap. It uses probability to determine how likely it is that the results seen in the sample are true for the larger population and not just due to random chance. This is often where you'll see terms like p-values and confidence intervals.
Essentially, descriptive statistics paints a picture of what we know for sure about our sample, while inferential statistics helps us make predictions about what we don't know—the population as a whole.
| Statistic Type | Goal | Example Question |
|---|---|---|
| Descriptive | Summarize and describe the features of a dataset. | What was the average age of patients in our study? |
| Inferential | Use sample data to make predictions about a population. | Does this new medication lower blood pressure in all patients? |
Common Measures
As you read medical research, you'll encounter several key statistical measures. You don't need to be a mathematician to understand their purpose.
- Standard Deviation: This tells you how spread out the data points are from the mean. A low standard deviation means the data is clustered tightly around the average, while a high one means it's more spread out.
- Correlation: This measures the relationship between two variables. For instance, is there a relationship between hours of exercise per week and cholesterol levels? Correlation doesn't prove one thing causes another, but it can show a connection.
- Risk Ratio (or Relative Risk): Often used to compare risk in two different groups. For example, it might compare the risk of developing heart disease in smokers versus non-smokers.
Understanding these basic terms provides a foundation for interpreting medical news and studies more critically.
Now, let's test your understanding of these core concepts.
A new health report summarizes the average blood pressure, the range of ages, and the most common pre-existing condition for the 1,500 participants in a study. What type of statistics is being used here?
In a clinical trial for a new drug, researchers study a group of 5,000 volunteers to see if the drug is effective. Their ultimate goal is to understand if the drug will be effective for everyone who might take it in the future. The group of 5,000 volunteers is known as the __________.