Decoding Health News
Understanding Medical Statistics
The Language of Health Data
Medical headlines can be confusing. One day a study says coffee is good for you; the next, it's bad. To make sense of it all, it helps to understand a few key statistical ideas. Let's start with two of the most common: incidence and prevalence.
Incidence
noun
The rate of new cases of a disease or condition that occur during a specific period.
Incidence measures how quickly something is spreading. Think of it like rain. Incidence is the number of new raindrops falling into a puddle over one minute. It tells you how fast the puddle is growing right now.
For example, if a town of 1,000 people saw 50 new cases of the flu in December, the incidence for that month would be 50 cases.
Prevalence
noun
The total number of individuals in a population who have a disease or condition at a specific point in time.
Prevalence, on the other hand, is a snapshot of how widespread a condition is. It’s not the raindrops, but the total size of the puddle at a particular moment. It includes both new and old cases.
If that same town had 200 people living with the flu on December 31st (including the 50 new cases), the prevalence on that day is 200 cases.
Incidence tells us about risk, while prevalence tells us about the overall burden of a condition in a community.
Risk, Correlation, and Causation
These three terms are often tangled together, but they mean very different things. Risk is simply the probability that an event will happen. For instance, a doctor might say you have a 1 in 10 risk of developing a certain condition.
More complex is the relationship between two things. This is where correlation and causation come in.
Correlation means two things trend together. When one goes up, the other goes up. A classic example is the correlation between ice cream sales and shark attacks. As ice cream sales increase, so do shark attacks. Does this mean eating ice cream causes shark attacks? No.
A third factor, hot weather, is responsible for both. More people buy ice cream and more people go swimming when it's hot, which increases the chance of a shark encounter. The two are correlated, but one doesn't cause the other.
Causation is much harder to prove. It means that one event is the direct result of another. To prove smoking causes lung cancer, researchers had to do decades of work to rule out other factors and show a direct biological link. Always be skeptical when you hear that two things are linked. Ask yourself: is it just a correlation, or is there real evidence of causation?
How We Study Health
So how do scientists figure these things out? They use different types of studies, each with its own strengths and weaknesses. The two main categories are observational and experimental studies.
In observational studies, researchers simply observe. They collect data without intervening or assigning treatments. It's like people-watching, but with a scientific goal.
There are two common types of observational studies:
-
Cohort Studies: Researchers follow a group of people (a cohort) over a long period. Some people in the group will be exposed to a certain risk factor (like a particular diet), and others won't. The researchers watch to see who develops a condition over time. These studies look forward.
-
Case-Control Studies: These studies work backward. Researchers start with a group of people who already have a disease (the "cases"). They then select a similar group of people who don't have the disease (the "controls"). They compare the past exposures of both groups to find potential risk factors.
Observational studies can be powerful, but they can only show correlation, not causation. To get closer to proving causation, researchers need to run an experiment.
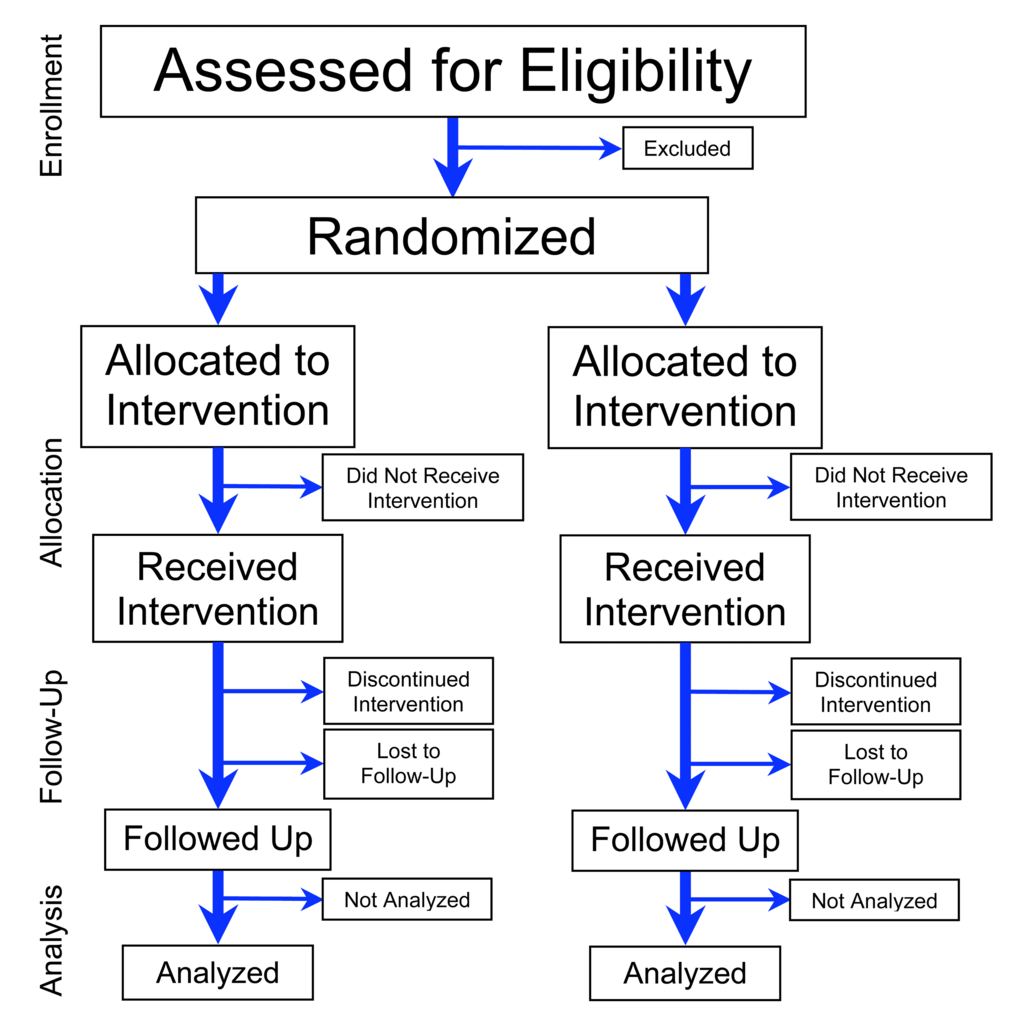
The gold standard for medical evidence is the Randomized Controlled Trial (RCT). In an RCT, participants are randomly assigned to one of two or more groups. One group receives the treatment being tested (like a new drug), while the other group—the control group—receives a placebo or the standard treatment.
Randomly assigning people helps ensure the groups are as similar as possible, minimizing bias. If there's a significant difference in outcomes between the groups, researchers can be more confident that the treatment caused it.
| Study Type | How it Works | Main Purpose |
|---|---|---|
| Cohort Study | Follows a group forward in time to see who gets sick. | Find links between exposure and disease. |
| Case-Control Study | Looks back in time from sickness to find exposures. | Identify potential risk factors for a disease. |
| Randomized Trial | Randomly assigns participants to treatment or control groups. | Determine if a treatment causes an effect. |
Now, let's test your understanding of these fundamental concepts.
A health department report states that there were 500 new cases of the flu reported in a city during the month of October. This figure represents the ________ of the flu.
A study finds that cities with more libraries have lower crime rates. This is a clear example of causation.
Understanding these basic ideas is the first step toward becoming a more informed reader of health news and scientific studies.