Decoding Health News
Understanding Medical Statistics
The Language of Health Data
When you read about a new medical study, you're often hit with a wave of numbers and terms. Understanding these is key to making sense of health information. Let's start with the basics: how researchers describe the center of a set of data. These are called measures of central tendency.
Mean
noun
The average of all the numbers in a dataset. You find it by adding all the values together and dividing by the count of values.
The mean is useful, but it can be misleading if there are extreme values, or outliers. For example, if five patients recover in 2, 3, 4, 5, and 30 days, the mean is 8.8 days. That long recovery time for one patient skews the average.
Median
noun
The middle value in a dataset that has been arranged in order. If there's an even number of values, it's the average of the two middle numbers.
The median gives a better sense of the typical patient's experience in this case, because it isn't affected by the one person who took much longer to recover. Lastly, there's the mode.
Mode
noun
The value that appears most frequently in a dataset.
The mode is helpful when you want to know the most common outcome, but it's less used in medical statistics than the mean and median.
Measuring the Spread
Knowing the average is only half the story. It's also important to know how spread out the data is. Are all the values clustered tightly around the mean, or are they all over the place? This is where standard deviation comes in.
Standard deviation
noun
A measure of how dispersed the data is in relation to the mean. A low standard deviation means data are clustered around the mean, and a high standard deviation indicates data are more spread out.
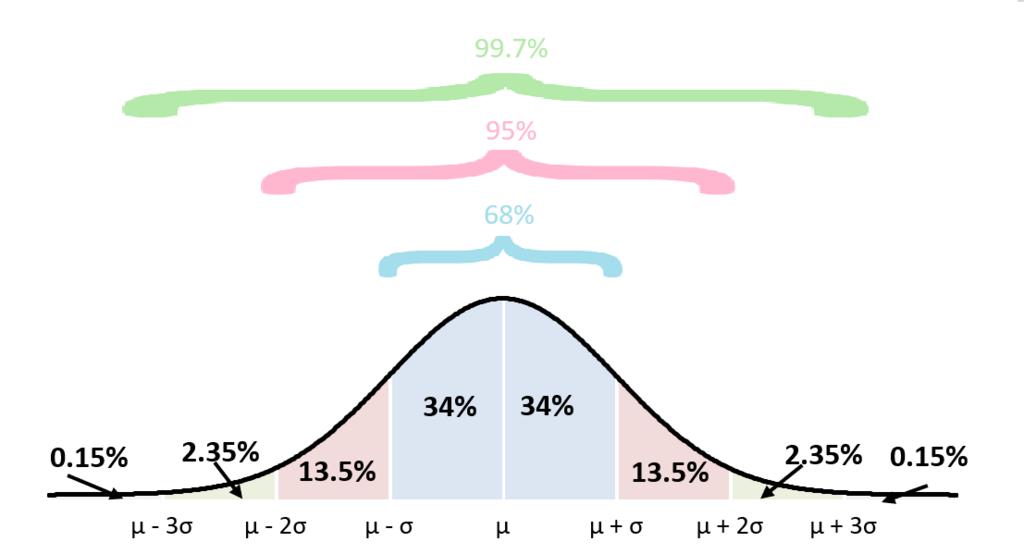
For many types of data that follow a bell-shaped curve (a normal distribution), about 68% of values lie within one standard deviation of the mean. About 95% lie within two, and 99.7% lie within three. In medicine, if a treatment has a small standard deviation for its effects, it means the results are consistent and predictable. If the standard deviation is large, the effects are more varied and less predictable.
Is It a Real Effect?
Imagine a study finds that a new drug lowers cholesterol more than a placebo. How do we know this wasn't just random luck? Researchers use p-values to help figure this out.
p-value
noun
The probability of obtaining test results at least as extreme as the results actually observed, assuming that there is no real effect. In simpler terms, it's the probability that the observed result occurred by chance.
In most medical research, a p-value of less than 0.05 is considered statistically significant. This means there is less than a 5% probability that the result was a fluke. It suggests the observed effect is likely real. However, a small p-value doesn't tell you how large or important the effect is. It only tells you that it's unlikely to be due to chance.
Two other concepts help add context: sample size and confidence intervals.
A larger sample size generally leads to more reliable results. A study with thousands of participants is more trustworthy than one with ten.
Confidence interval
noun
A range of values that's likely to contain the true population value. It's often expressed as a percentage, like a 95% confidence interval.
A 95% confidence interval means that if you were to repeat the study 100 times, the true result for the entire population would fall within that range 95 times. A narrow interval (e.g., 4 to 6 pounds) suggests a precise estimate. A wide interval (e.g., 1 to 9 pounds) suggests more uncertainty, often due to a smaller sample size.
Putting Risk in Perspective
Medical news often reports on risk, but the numbers can be framed in different ways. Understanding the difference between absolute risk and relative risk is crucial.
Absolute risk is the chance of something happening. Relative risk compares the risk in two different groups.
Let's say a certain condition affects 2 out of every 1000 people. A new treatment reduces that to 1 out of every 1000 people.
| Metric | Calculation | Result |
|---|---|---|
| Absolute Risk Reduction | The difference in risk between the groups (2/1000 - 1/1000) | 1 in 1000, or 0.1% |
| Relative Risk Reduction | The percentage reduction in risk compared to the original risk (1/2) | 50% |
A headline might shout, "New Drug Cuts Risk by 50%!" This is the relative risk, and it sounds huge. But the absolute risk reduction shows that the treatment prevents the condition in only 1 out of every 1000 people. Both numbers are correct, but they tell very different stories. Always look for the absolute risk to understand the true impact.
A new weight loss drug is tested. Researchers report a p-value of 0.04. What does this p-value tell us?
A study reports that a new treatment reduces the risk of heart attack. The absolute risk reduction is 1%, while the relative risk reduction is 50%. Which statement is the most accurate interpretation?
These core concepts are the foundation for interpreting medical data. By understanding them, you can look past the headlines and assess health claims more critically.