Decoding Health Headlines and Stats
Understanding Medical Statistics
Making Sense of Medical Data
When you read about a new medical study, you're often hit with a wave of numbers and statistical terms. Understanding a few key concepts can help you cut through the noise and grasp what the findings really mean. The first step is to understand how researchers describe their data.
They often start with measures of central tendency, which are single numbers that try to describe the “center” of a dataset. You’ve likely heard of the big three: mean, median, and mode.
Mean
noun
The average of all the numbers in a dataset. You find it by adding all the values together and dividing by the number of values.
Median
noun
The middle value in a dataset that has been arranged in numerical order. If there's an even number of values, it's the average of the two middle numbers.
Mode
noun
The value that appears most frequently in a dataset.
So why have three different measures? Imagine we’re looking at the recovery time in days for a small group of patients trying a new therapy.
| Patient | Recovery Time (Days) |
|---|---|
| 1 | 5 |
| 2 | 6 |
| 3 | 7 |
| 4 | 7 |
| 5 | 70 |
The mean recovery time is (5 + 6 + 7 + 7 + 70) / 5 = 19 days. But look at the data. Most patients recovered in about a week. The one patient who took 70 days—an outlier—drags the average way up.
The median is the middle value: 5, 6, 7, 7, 70. It’s 7 days. This number better represents the typical patient's experience.
The mode is the most common number, which is also 7 days. In medical data, the median is often more useful than the mean when outliers are present.
Beyond the Average
Knowing the “center” of the data is helpful, but it doesn't tell the whole story. We also need to know how spread out the data is. This is called variability. Are all the data points clustered tightly around the average, or are they all over the place?
The most common measure of variability is the standard deviation.
Standard deviation
noun
A measure of how dispersed the data is in relation to the mean. A low standard deviation means the data points tend to be close to the mean, while a high standard deviation indicates that the data points are spread out over a wider range.
Imagine two drugs that both lower blood pressure by an average of 10 points. Drug A has a small standard deviation, meaning most patients get a reduction of around 10 points. Drug B has a large standard deviation, meaning some patients see a huge drop while it does almost nothing for others. Drug A is more reliable.
For data that follows a bell-shaped curve, or normal distribution, the standard deviation tells us a lot.
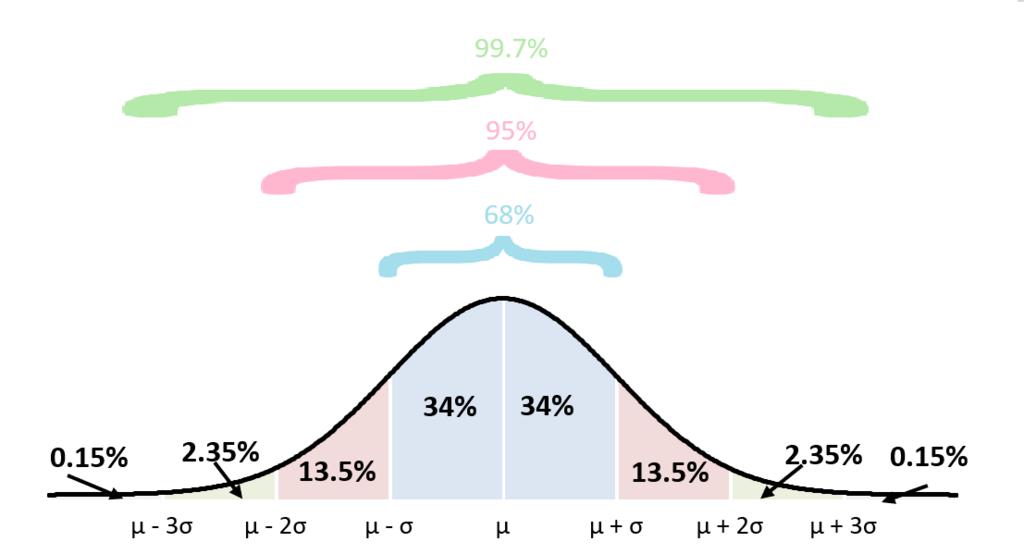
This rule tells us that roughly 68% of data points fall within one standard deviation of the mean, 95% fall within two, and 99.7% fall within three. This is a powerful shortcut for understanding the data's spread.
Are the Results Reliable?
The best description of data won't matter if the study itself is flawed. One of the most important factors is sample size. This is simply the number of participants in a study. A study with 10,000 participants is generally more reliable than a study with 10. A larger sample size helps ensure that the results aren't just a fluke and that the participants are representative of the larger population.
Think of it like tasting soup. If you only take one spoonful from the edge, you might just get a piece of carrot. To really know what the soup tastes like, you need to stir it and take a big enough scoop to get a mix of all the ingredients.
But how do we know if a study's findings are a real effect or just random chance? This is where the concept of statistical significance comes in. Researchers use tests to determine the likelihood that their results happened by chance.
This is often expressed with a p-value. A p-value is the probability of observing your data (or something more extreme) if there was actually no effect. For example, if you were testing a new drug, the 'no effect' scenario would be that the drug works no better than a placebo.
A small p-value suggests that your observed result is unlikely to be due to chance. In most medical research, the cutoff for significance is a p-value of less than 0.05.
A p-value of 0.03 means there is a 3% chance of seeing the observed effect if the treatment truly did nothing. Since this is less than 5%, the result is considered statistically significant.
While a p-value tells you whether an effect is likely real, a confidence interval (CI) gives you a range of plausible values for that effect. Most often, you'll see a 95% confidence interval.
This means that if you were to repeat the study 100 times, you would expect the true value of the effect to fall within this calculated range 95 times.
Let's say a study finds that a new diet causes an average weight loss of 5 pounds, with a 95% CI of [3, 7] pounds. This gives us a plausible range for the true average weight loss. Since the entire range is above zero, it supports the conclusion that the diet is effective.
However, if the 95% CI was [-1, 11] pounds, we can't be as sure. Because the range includes zero (no weight loss), the result is not statistically significant. The true effect might be weight loss, weight gain, or nothing at all.
A study reports on the yearly income of a small group of people: 40k, 60k, and $1 million. Which measure of central tendency would give the most misleading impression of the "typical" income for this group?
Two different clinics are testing a new treatment to reduce patient anxiety scores. Both clinics report the same average (mean) reduction in anxiety. However, Clinic A reports a small standard deviation, while Clinic B reports a large standard deviation. What does this suggest?
By understanding these basic concepts—mean, median, standard deviation, sample size, p-values, and confidence intervals—you're better equipped to look at medical news and research with a critical eye.