Decoding Election Polls
Understanding Polling Basics
What Polls Tell Us
Election polls are snapshots. They capture a picture of public opinion at a specific moment in time. Think of it like tasting a spoonful of soup to know what the whole pot tastes like. If the soup is well-stirred, that one spoonful gives you a pretty good idea of the overall flavor. Polls aim to do the same thing for an election.
Their main job is to measure what a population thinks about candidates or issues. For candidates, this information is vital for shaping campaign strategy. For the public and the media, polls offer a way to understand the political landscape leading up to an election day. They gauge who's ahead, who's behind, and what issues are resonating with voters.
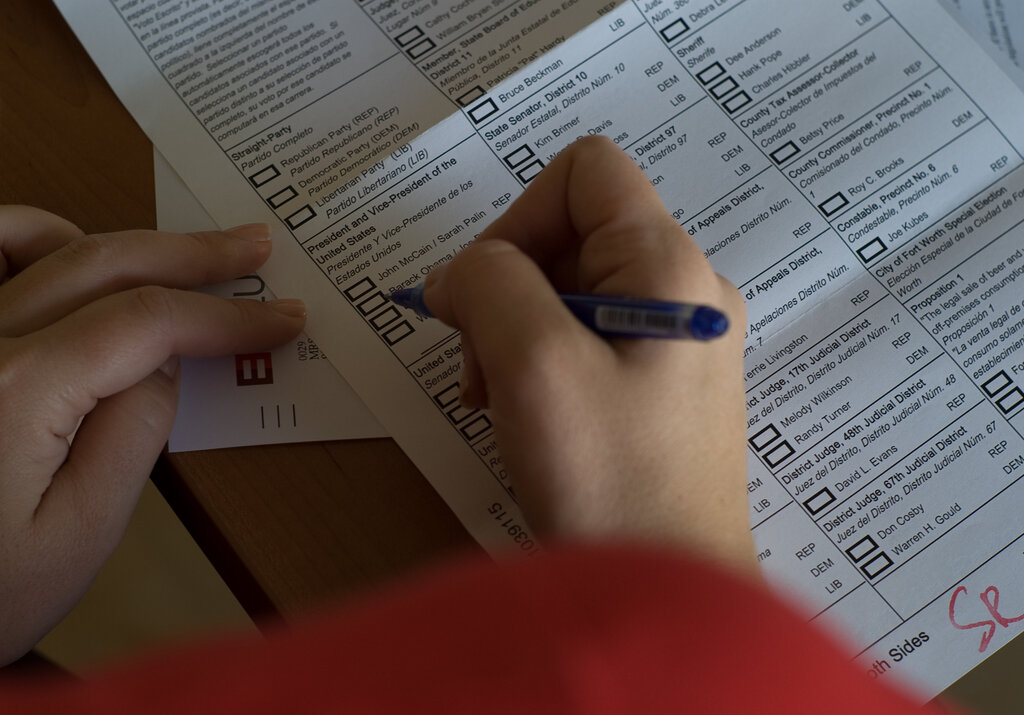
A poll isn't a prediction of the future. It's a measurement of the present.
How Pollsters Ask
There are several ways to conduct a poll, each with its own strengths and weaknesses. The most common methods are telephone calls, online surveys, and in-person interviews.
Telephone polls used to be the gold standard. Pollsters would use random-digit dialing to reach a representative mix of people, including both landlines and cell phones. However, with the rise of call screening and a general reluctance to answer unknown numbers, getting people to participate has become much harder.
Online polls are now very common. High-quality online polls build panels of participants that are carefully selected to reflect the broader population. These are different from the informal, unscientific polls you might see on a website or social media, where anyone can vote. Those are fun, but they don't tell you much about what the overall population thinks.
In-person polls, like exit polls, survey voters just after they've cast their ballots. These can provide insight into why people voted the way they did and which demographic groups supported which candidates.
| Method | Pros | Cons |
|---|---|---|
| Telephone | Reaches a wide demographic | Declining response rates, expensive |
| Online | Cost-effective, fast | Sample quality can vary, potential for self-selection bias |
| In-Person | High response rates, detailed data | Very expensive, only captures the views of actual voters |
A good poll will publish its methodology, the proportion of cell phones to landlines called, its margin of error, its response rate.
Getting a Good Sample
The most critical part of any poll is sampling. The goal is to survey a small group of people (the sample) that accurately reflects the entire group you want to understand (the population). To do this, pollsters rely on random sampling.
In a random sample, every single person in the population has an equal chance of being selected to participate. This is what makes the soup analogy work. If you only take a spoonful from the top, you might just get broth. You need to stir the pot and dip your spoon in randomly to get a bit of everything. Random sampling is the pollster's way of stirring the pot.
Without random sampling, a poll might overrepresent one group and underrepresent another, leading to a skewed result. A poll of just your friends, for example, wouldn't be a good measure of your whole city's opinion, because your friends likely share similar backgrounds and viewpoints.
Reading the Fine Print
When you see a poll's results, you'll often see two other important pieces of information: the margin of error and the confidence level. These terms help you understand the poll's precision.
margin of error
noun
A measure of how much the results of a poll are expected to differ from the actual views of the entire population because of random chance in sampling.
The margin of error is a poll's built-in acknowledgment that it isn't perfect. If a poll says a candidate has 45% support with a margin of error of ±3%, it means their true level of support in the population is likely between 42% and 48%. This range is what's important, not just the single number.
Closely related is the confidence level, which is usually 95%. This means that if the same poll were conducted 100 times, you could expect the results to be within the margin of error 95 of those times. It's a measure of how certain the pollsters are that their sample accurately captured the opinion of the population.
When the gap between two candidates in a poll is smaller than the margin of error, the race is considered a 'statistical tie.' No one is clearly ahead.
Understanding these basics allows you to look past the headlines and interpret polling data more thoughtfully. It helps you see polls for what they are: a useful, but imperfect, guide to public opinion.