Decoding Earnings Reports for Stock Investment
Understanding Financial Statements
The Company Report Card
Think of financial statements as a company's report card. They don't just show numbers; they tell a story about a company's health and performance. By learning to read them, you can understand where a company's money comes from, where it goes, and how well it's being managed. There are three core documents that provide this insight.
The three key financial statements work together. The Balance Sheet, Income Statement, and Cash Flow Statement form a complete picture of profitability, stability, and cash management.
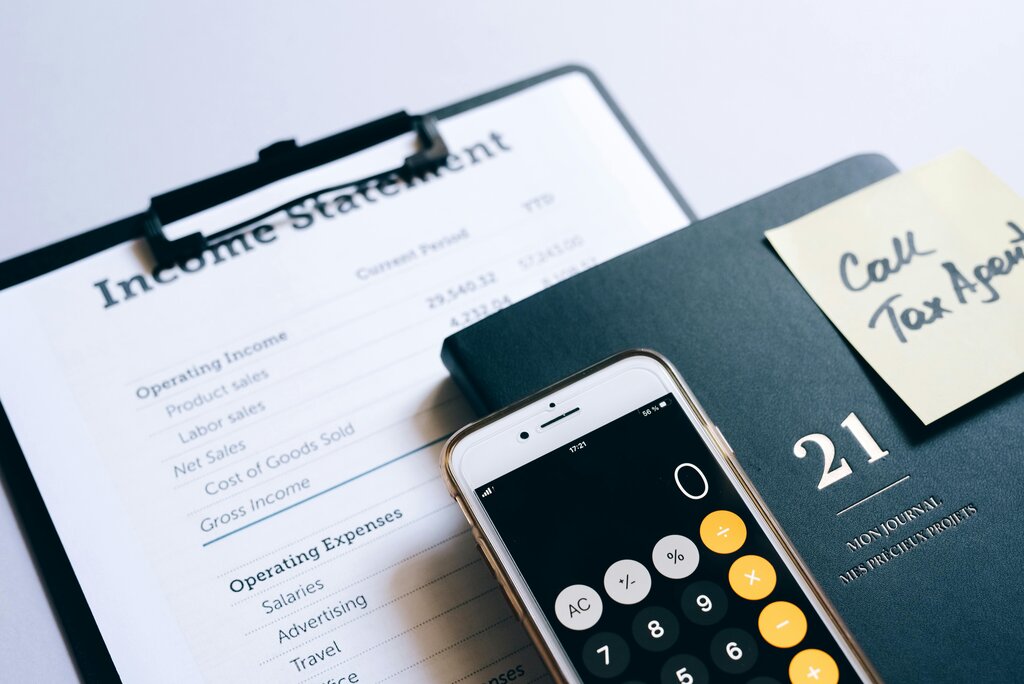
The Income Statement
The income statement, also known as the Profit & Loss (P&L) statement, shows how profitable a company was over a specific period, like a quarter or a year. It's a summary of performance over time, not just a snapshot on a single day.
It starts with the company's total sales, or revenue. From this, it subtracts all the costs and expenses incurred to generate that revenue. The final result is the famous "bottom line": net income.
The basic formula is straightforward: Revenues - Expenses = Net Income.
Key items you'll find on an income statement include:
- Revenue (or Sales): The total amount of money generated from sales of goods or services.
- Cost of Goods Sold (COGS): The direct costs of producing the goods sold by a company.
- Gross Profit: What's left after subtracting COGS from revenue ().
- Operating Expenses: Costs not directly tied to production, like salaries, marketing, and rent.
- Net Income: The profit after all expenses, including taxes and interest, have been paid.
The Balance Sheet
Unlike the income statement, which covers a period of time, the balance sheet is a snapshot. It shows a company's financial position at a single moment in time. It answers the questions: What does the company own, and what does it owe?
The balance sheet is built on a fundamental equation that must always, well, balance.
Let's break that down:
- Assets are what a company owns. This includes cash, inventory, buildings, and equipment.
- Liabilities are what a company owes to others. This includes loans, accounts payable (bills to suppliers), and other debts.
- Equity represents the owners' stake in the company. It's the value that would be left for shareholders if all assets were sold and all liabilities were paid off.
The Cash Flow Statement
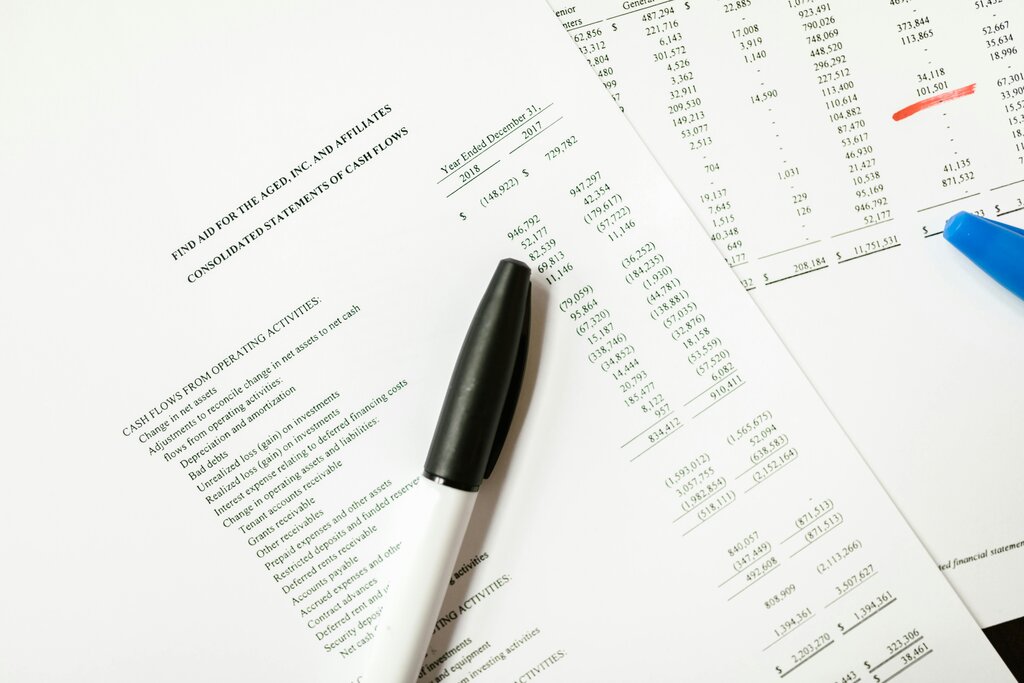
Profit is important, but a company pays its bills with cash. A profitable company on paper can go bankrupt if it doesn't have enough cash to cover its immediate expenses. The cash flow statement tracks the movement of cash into and out of the company over a period.
It breaks cash movements down into three categories:
- Operating Activities: Cash generated from or used in the company's main business operations.
- Investing Activities: Cash used to buy or sell long-term assets, like property or equipment.
- Financing Activities: Cash from investors or banks, such as issuing stock or taking out loans, and cash paid out, like dividends or debt repayments.
This statement is crucial because it reconciles the net income from the income statement (which can include non-cash items like depreciation) with the actual change in the company's cash balance.
How They Connect
These three statements are not independent; they are intrinsically linked and tell a cohesive story.
- The net income from the income statement is the starting point for the operating activities section of the cash flow statement.
- Also, net income (minus any dividends paid to shareholders) flows into the balance sheet as retained earnings, which is a component of equity.
- The ending cash balance on the cash flow statement must match the cash amount shown on the balance sheet for that period.
Understanding each statement on its own is the first step. Seeing how they fit together gives you a complete picture of a company's financial story. This foundation is essential for any deeper analysis.
Which financial statement provides a snapshot of a company's assets, liabilities, and equity at a single point in time?
If a company has 200,000, what is its Gross Profit?
With this overview, you're now ready to look at these documents and start piecing together the financial narrative of a business.