Decoding Bar Chart Price Action
Introduction to Price Action
What Is Price Action?
Price action trading is the practice of making decisions based on the movement of an asset's price, as seen on a chart. Instead of relying on complex indicators that analyze past data, you focus on the raw price itself. Think of it as learning to read the market's body language. The price chart tells a story about the battle between buyers and sellers, and price action is the language of that story.
Every tick up or down reflects the collective actions and beliefs of all market participants. When you analyze price action, you are essentially eavesdropping on the market's conversation. Who is winning the argument, the buyers (bulls) or the sellers (bears)? The answer is written directly on the chart.
Price action shows the real-time supply and demand dynamics in a market. It's the most direct information a trader can get.
To read price action, traders often use bar charts or candlestick charts. Each bar or candle represents a specific time period (like one hour or one day) and shows four key pieces of information: the opening price, the highest price, the lowest price, and the closing price. This is often called OHLC data.
A bar where the closing price is higher than the opening price suggests that buyers were more aggressive during that period. This is often colored green and is considered bullish. Conversely, if the closing price is below the opening price, it means sellers were in control. This bar is often red and is considered bearish. The length of the bar from high to low also tells you about the period's volatility.
Price Action vs. Indicators
Many new traders are drawn to technical indicators, which are mathematical calculations based on price and/or volume. While indicators can be useful, they have one major drawback: they are lagging. An indicator is always a step behind the price because it's derived from past price data.
Price action, on the other hand, is happening now. It's the source data from which all indicators are built. By learning to read price action directly, you are getting your information straight from the market, without the filter or delay of an indicator. This allows for quicker, and often clearer, decision-making.
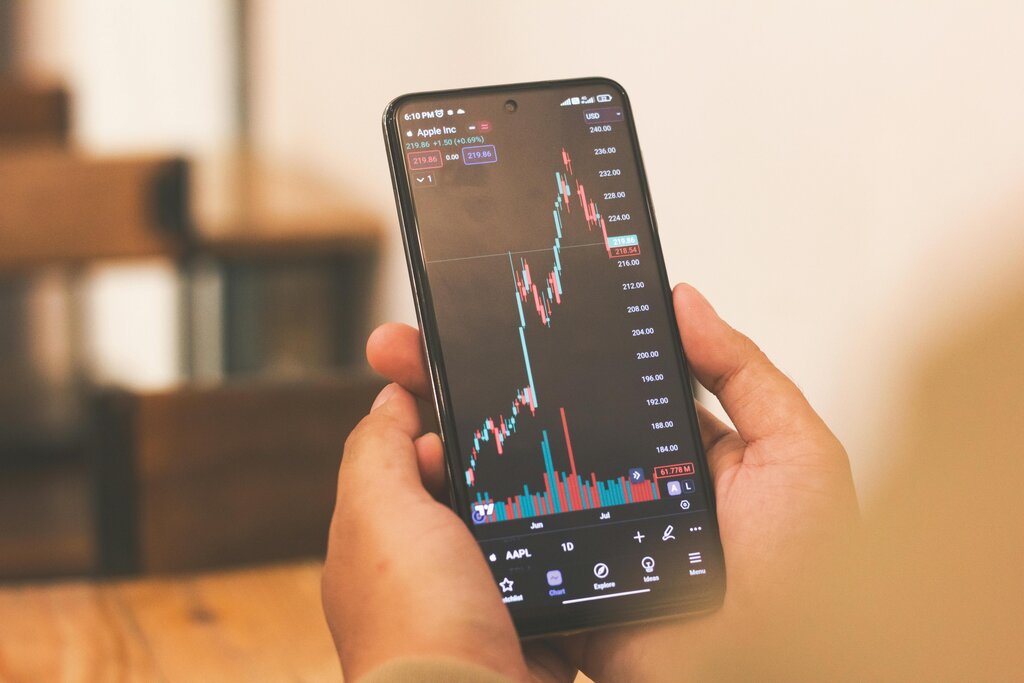
Focusing on price action also simplifies the trading process. Instead of cluttering your charts with multiple indicators that can sometimes give conflicting signals, you have a clean view of what matters most: the price itself. This clarity helps you focus on the current market structure and identify potential trading opportunities with greater confidence.
Technical analysis is the study of price action and market data to forecast future price movements.
Let's test your understanding of these core concepts.
What is the primary focus of a price action trader?
According to the principles of price action, what is the main disadvantage of relying solely on technical indicators?
By focusing on the raw movements of price, you learn to interpret the market's story directly, giving you a powerful foundation for your trading decisions.