Datadog Observability Essentials
Introduction to Observability
Understanding Your System
Imagine you're driving a car. The dashboard tells you your speed, fuel level, and engine temperature. This is like traditional monitoring: it tracks a predefined set of things you know are important. But what if the car starts making a strange noise you've never heard before? The dashboard won't tell you what's wrong. For that, a mechanic needs to connect a diagnostic tool, run tests, and ask specific questions to understand the problem. That's observability.
Observability is the ability to understand the internal state of a system by examining its external outputs. In modern software, where applications are complex and distributed across many services, things can go wrong in unpredictable ways. Observability gives you the power to ask new questions about your system without having to ship new code to answer them. It's not just about knowing that something is wrong, but being able to figure out why.
Monitoring tells you whether a system is working. Observability lets you ask why it isn’t working.
The Three Pillars
Observability is built on three core types of telemetry data: metrics, logs, and traces. While each is useful on its own, their real power comes from using them together to get a complete picture of your system's health.
Metrics are numerical measurements collected over time. Think of them as the vital signs of your application. They tell you about the overall health of your system at a glance, like CPU usage, memory consumption, or response times. Metrics are great for spotting trends and triggering alerts when a value crosses a certain threshold, but they don't always explain the cause of the problem.
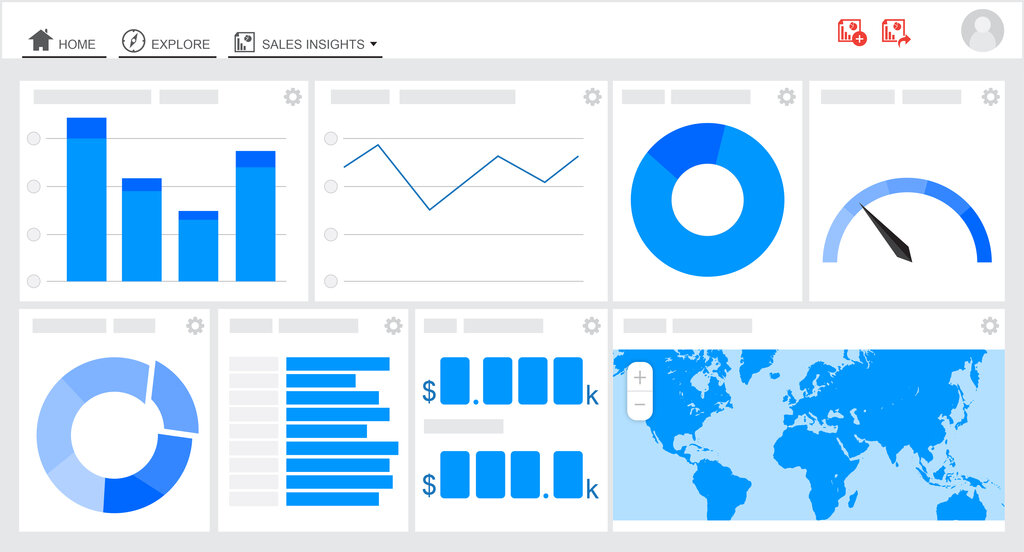
Logs are timestamped, detailed records of specific events that occurred within the system. If metrics tell you that something is wrong, logs are where you go to find out what happened. Each log entry provides context around an event, such as an error message, a user action, or a system state change. Sifting through logs can help you pinpoint the exact sequence of events that led to an issue.
Traces show the journey of a single request as it travels through all the different services in your application. In a microservices architecture, a simple action like a button click can trigger a chain reaction across dozens of services. A trace follows this entire path, showing how long each step took and where bottlenecks or failures occurred. Traces are essential for understanding performance issues in complex, distributed systems.
| Pillar | What It Is | What It Tells You |
|---|---|---|
| Metrics | Aggregated numerical data | "The system is slow." |
| Logs | Detailed, timestamped events | "This specific error occurred at 10:05 AM." |
| Traces | A request's end-to-end journey | "The database query is taking 3 seconds." |
Observability vs. Monitoring
People often use the terms monitoring and observability interchangeably, but they represent two different approaches to understanding system health. Monitoring is about watching for things you already know can go wrong. You define specific metrics, set up dashboards, and create alerts for known failure conditions. It’s a proactive way to keep an eye on predefined indicators.
Monitoring is about answering known unknowns. Observability is about exploring unknown unknowns.
Observability, on the other hand, is about exploration and debugging. It assumes you can't predict every possible failure. Instead of just collecting data for pre-set dashboards, an observable system provides rich, detailed data (logs, metrics, and traces) that you can query in flexible ways. It allows you to ask new questions on the fly and drill down to find the root cause of problems you never anticipated.
Ultimately, monitoring is a subset of observability. You need good monitoring to know when something is wrong, but you need observability to figure out why. In today's complex cloud-native environments, having this deep, explorable insight is no longer a luxury—it's essential for building and maintaining reliable software.
According to the car analogy presented, a car's dashboard showing your speed and fuel level is an example of monitoring.
Which of the following are considered the three core pillars of observability?