Data Visualization for Persuasive Reports
Introduction to Data Visualization
Seeing the Story in the Numbers
Data, in its raw form, is often just a massive list of numbers and text. A spreadsheet with thousands of rows doesn't tell a story on its own. It's hard to see what's important, what's changing, or what's out of the ordinary. This is where data visualization comes in.
Data visualization is the practice of turning raw data into graphical representations like charts, graphs, and maps. The goal is simple: to make complex information understandable at a glance. Think of it as translating a dense block of text into a clear, compelling picture. Suddenly, patterns, trends, and outliers that were hidden in the numbers pop out.

By presenting data visually, we tap into our brain's natural ability to process images. We can spot relationships and understand key messages much faster than by reading through tables. It’s not about making data look pretty; it's about revealing the insights hiding within it.
Why It Matters
In a world flooded with information, getting a point across clearly and quickly is a superpower. Data visualization is a crucial tool for communication. It bridges the gap between technical data experts and the people who need to use their findings to make decisions.
A well-crafted chart can communicate a finding far more effectively than a long report. It helps people see the significance of the data, leading to better, faster, and more informed decisions. Whether it's a business leader deciding on a new strategy, a scientist presenting research findings, or a journalist explaining a complex issue to the public, visuals make the data accessible to everyone.
Data visualization should be more than just cold, hard numbers, it should have a clear story that keeps the audience engaged and gradually reaches a conclusion.
Ultimately, transforming data into a visual story helps people connect with the information on a deeper level. It helps them understand the context, grasp the implications, and feel confident in the actions they take based on the insights.

Tools of the Trade
There are many tools available for creating data visualizations, ranging from simple to highly sophisticated. You don't need to be a coding expert to get started. Many tools are designed for beginners, while others offer powerful customization for data scientists.
Here's a quick look at the main categories of tools:
| Tool Category | Examples | Best For |
|---|---|---|
| Spreadsheet Software | Microsoft Excel, Google Sheets | Basic charts and quick analysis. |
| Business Intelligence (BI) Tools | Tableau, Microsoft Power BI | Interactive dashboards and detailed reports. |
| Programming Languages | Python (with Matplotlib, Seaborn), R (with ggplot2) | Custom, complex, and highly tailored visualizations. |
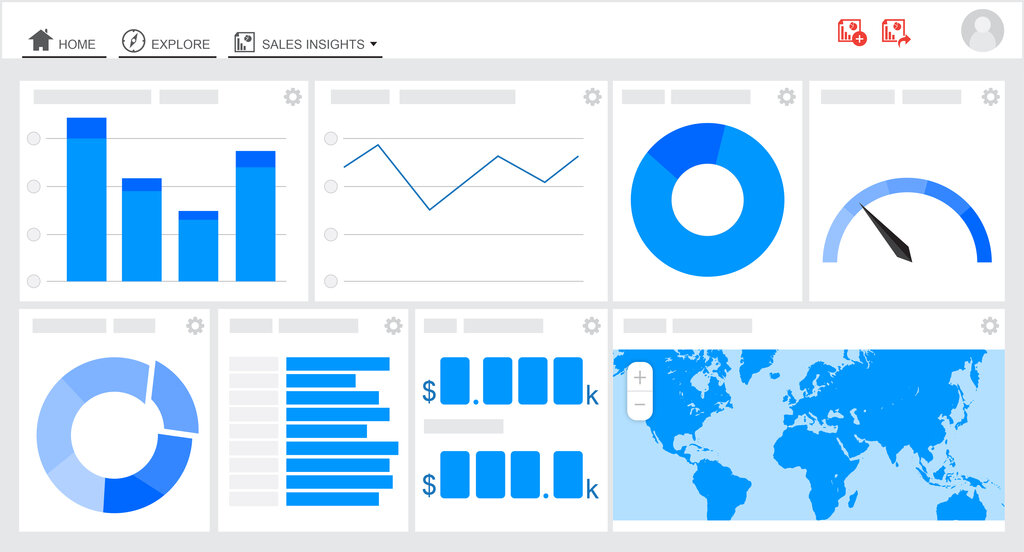
Each category serves a different purpose. Spreadsheet tools are great for everyday tasks. BI tools are the standard for creating professional dashboards that allow users to explore the data themselves. Programming languages offer the ultimate flexibility for creating unique visuals from scratch.
Now, let's test your understanding of these core concepts.
What is the primary goal of data visualization?
Data visualization is an effective communication tool primarily because it:
Understanding what data visualization is and why it's used is the first step. It's a skill that allows you to unlock the stories hidden in data and share them with the world.