Data Science for Platform Economics
Data Science Fundamentals
What Is Data Science?
Data science is the process of using data to understand the world and make better decisions. Think of a data scientist as a detective. They gather clues (data), look for patterns, and build a case (a model or insight) to solve a mystery. It’s not just one skill, but a blend of several fields.
At its core, data science combines:
- Math and Statistics: The foundation for understanding data, identifying trends, and testing ideas.
- Computer Science: The tools to collect, clean, process, and analyze large datasets efficiently.
- Domain Expertise: The specific knowledge about a particular field—like business, healthcare, or sports—that gives context to the data.
Without context, numbers are just numbers. With context, they tell a story.
The Building Blocks of Data
Before we can analyze data, we need to understand what it looks like. Data comes in different types and is organized in various structures.
| Category | Type | Description | Example |
|---|---|---|---|
| Quantitative | Continuous | Can take any value within a range. | Height (68.5 inches), Temperature (98.6°F) |
| (Numbers) | Discrete | Can only take specific, separate values. | Number of siblings (3), Shoe size (9) |
| Qualitative | Categorical | Represents distinct groups or categories. | Eye color (Blue, Brown), T-shirt size (S, M, L) |
| (Categories) | Ordinal | Categories that have a natural order. | Customer satisfaction (Low, Medium, High) |
How is this data collected? Methods range from simple surveys and customer feedback forms to more technical approaches like web scraping (extracting data from websites) or using APIs (Application Programming Interfaces) to pull data directly from services like Twitter or a weather provider.
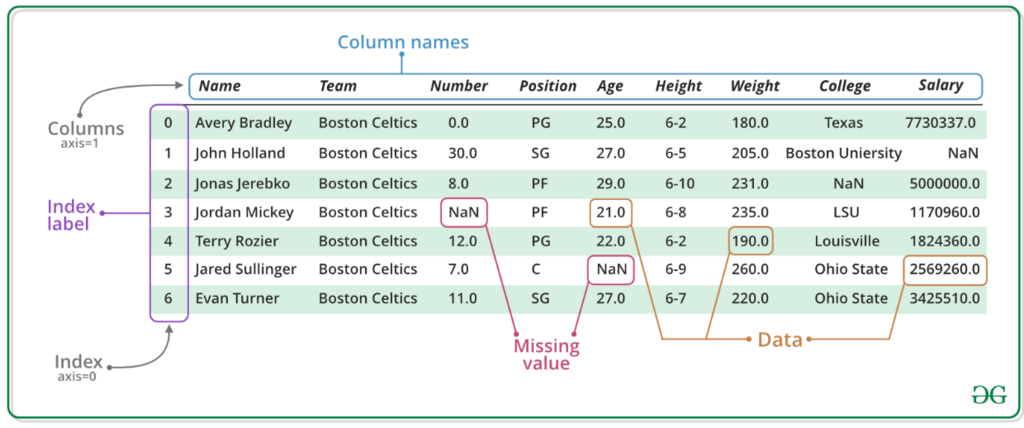
Once collected, we often organize data into structures. The most common in data science is the DataFrame—a table with rows and columns, much like a spreadsheet. Each row is an observation (like a single customer), and each column is a feature (like age or purchase amount).
Making Sense of Numbers
Raw data alone isn't very useful. We use statistics to summarize it and uncover its meaning. You're likely already familiar with a few basic statistical measures called measures of central tendency. They tell us where the 'center' of the data is.
- Mean: The average value. You find it by summing all values and dividing by the count of values.
- Median: The middle value when the data is sorted from smallest to largest.
- Mode: The value that appears most frequently.
Statistics also helps us deal with uncertainty through probability. Probability is a measure of how likely an event is to occur, on a scale from 0 (impossible) to 1 (certain). A coin flip has a 0.5 probability of landing on heads. While we can't predict a single flip, probability helps us understand the pattern over many flips.
Your Data Science Toolkit
To perform these analyses on large datasets, data scientists use programming. The most popular language for data science is Python, thanks to its powerful and easy-to-use libraries.
Think of libraries as toolkits for programmers. Instead of building a tool from scratch every time, you can just grab one that's already been perfected.
For data science in Python, a few libraries are essential.
NumPy (Numerical Python) is the foundation for scientific computing. It lets us create powerful, multi-dimensional arrays and perform mathematical operations on them with incredible speed.
import numpy as np

# Create a NumPy array of heights in inches
heights = np.array([67, 71, 64, 75, 69])

# Convert heights from inches to centimeters
heights_cm = heights * 2.54

print(heights_cm)
Pandas is built on top of NumPy and is the primary tool for data manipulation and analysis. It introduces the DataFrame, which makes cleaning, filtering, sorting, and exploring data straightforward.
import pandas as pd

# Create a DataFrame from a dictionary
data = {'Name': ['Alice', 'Bob', 'Charlie'],
        'Age': [25, 30, 28]}
df = pd.DataFrame(data)

# Select just the 'Age' column
ages = df['Age']

print(ages.mean()) # Calculate the mean age
Finally, once we have insights, we need to communicate them. Matplotlib and Seaborn are visualization libraries that help us create charts and graphs. A good visualization can reveal patterns that are impossible to see in a table of numbers.
import matplotlib.pyplot as plt
import seaborn as sns

# Use the DataFrame from the previous example
sns.barplot(x='Name', y='Age', data=df)

plt.title('Ages of Individuals')
plt.show()
These tools form the bedrock of data science work. By mastering them, you can start to explore datasets and uncover the stories hidden within.
Now, let's test your knowledge on these foundational concepts.
Data science is described as an interdisciplinary field combining which three core areas?
In a typical DataFrame, rows represent individual ______ and columns represent ______, much like a spreadsheet.
With these basics in hand, you're ready to start exploring data on your own.