Data Science for Economics Essentials
Introduction to Data Science
What Is Data Science?
Data science is the practice of using data to understand the world and make better decisions. Think about the last time a streaming service recommended a movie you loved. That wasn't a lucky guess. It was data science at work, analyzing your viewing history and comparing it to millions of others to predict what you'd enjoy next.
At its core, data science combines three key areas: computer science, statistics, and domain expertise. You need computer science skills to manage and process large datasets, statistical knowledge to find meaningful patterns, and expertise in a specific field—like economics, medicine, or marketing—to ask the right questions and understand the answers. It’s this blend that turns raw numbers into valuable insights.
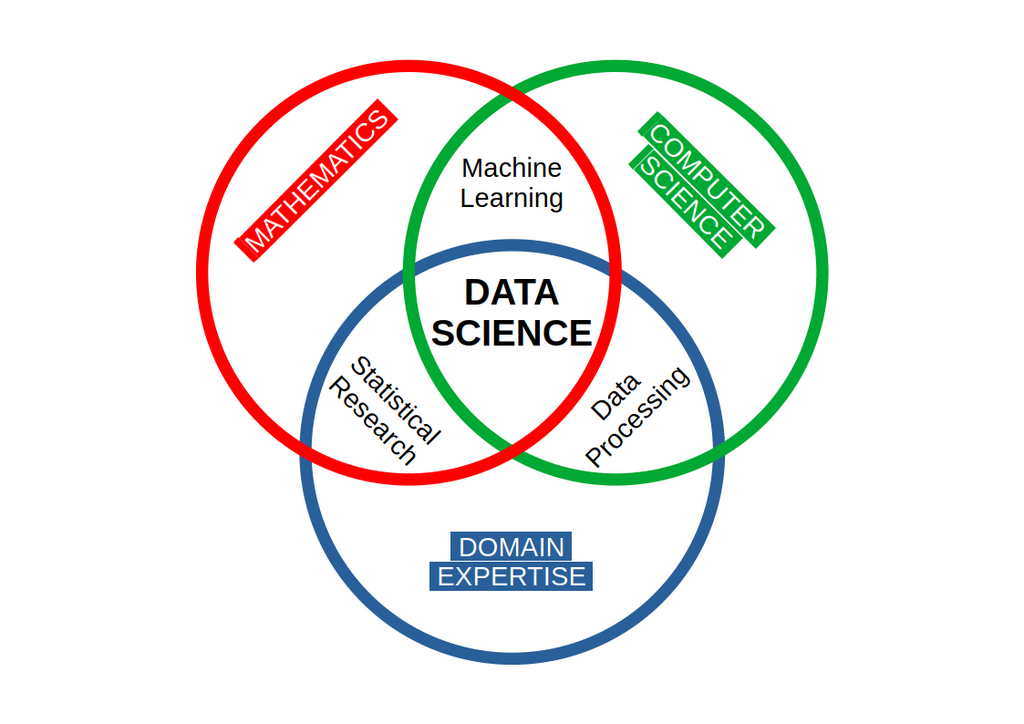
This process of turning data into insights isn't random. It follows a structured path, often called the data science lifecycle.
The Data Science Lifecycle
Every data science project follows a general cycle. It’s a roadmap that guides an analyst from a raw collection of facts to a useful conclusion. While the specifics can change, the core stages remain consistent.
1. Data Collection: This is where it all begins. Data can be gathered from anywhere: customer surveys, website clicks, financial transactions, satellite imagery, or sensor readings. The goal is to collect the raw material needed to answer a specific question.
2. Data Cleaning: Raw data is rarely perfect. It's often messy, with missing values, typos, and inconsistencies. The cleaning phase involves correcting these errors and formatting the data into a tidy, usable state. This step is crucial and often takes up the most time in a project.
3. Data Analysis: Once the data is clean, the real investigation starts. Analysts use statistical methods and algorithms to explore the data, identify patterns, and build models. This is where they might discover a correlation between advertising spend and sales, or identify different segments of customers based on their behavior.
4. Interpretation & Communication: The final step is to make sense of the findings and share them with others. An analysis is only useful if its story can be told clearly. This often involves creating charts and visualizations to present the results in a way that is easy for anyone to understand, leading to better, data-informed decisions.
Tools of the Trade
To perform these steps, data scientists rely on specialized tools. The most common are programming languages designed for handling and analyzing data. Two languages dominate the field: Python and R.
Python is a general-purpose language known for its simple, readable syntax. It has a massive ecosystem of libraries like pandas for data manipulation and scikit-learn for machine learning, making it incredibly versatile.
R was built by statisticians for statistical analysis. It excels at complex statistical modeling and creating high-quality data visualizations. While Python is more of a jack-of-all-trades, R is a master of statistical computing.
Both are powerful, free, and supported by large communities. The choice between them often comes down to personal preference or the specific requirements of a project.
Data science is an interdisciplinary field that primarily combines which three key areas?
A data analyst spends several days correcting typos, filling in missing values, and standardizing formats in a newly acquired dataset. Which stage of the data science lifecycle does this work describe?
Understanding these core concepts—what data science is, its lifecycle, and the tools involved—provides a solid foundation for exploring how data can be used to generate powerful insights.