Data Mining Strategies and Practical Applications
Data Preparation Frameworks
The CRISP-DM Framework
To move from raw data to a useful model, you need a roadmap. The Cross-Industry Standard Process for Data Mining, or CRISP-DM, is one of the most widely used frameworks. It breaks down a data mining project into a cycle of six phases, ensuring a structured and thorough approach.
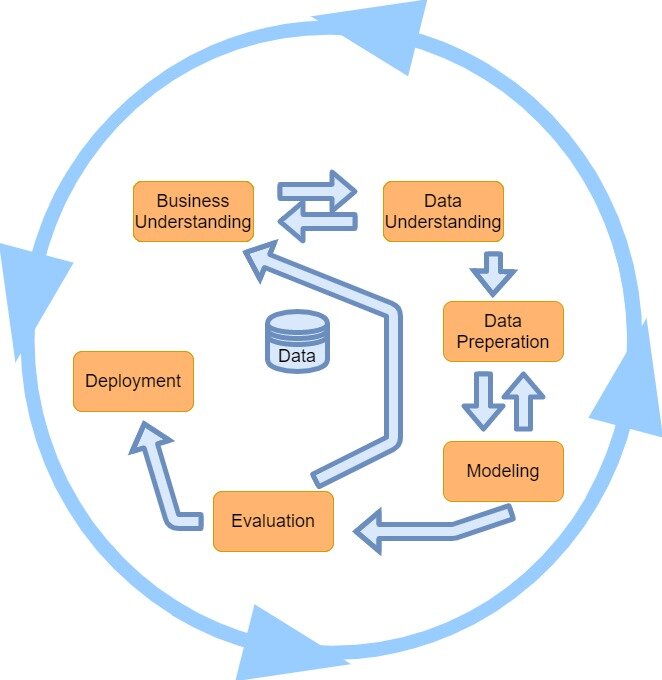
The phases are:
- Business Understanding: What problem is the business trying to solve?
- Data Understanding: What data do we have, and what does it mean?
- Data Preparation: Cleaning and shaping the data for modeling.
- Modeling: Choosing and applying algorithms to find patterns.
- Evaluation: Does the model meet the business goals?
- Deployment: Integrating the model into business operations.
Notice the arrows in the diagram. They show that the process is not strictly linear. You often have to loop back. For instance, evaluating a model might reveal issues that send you right back to the data preparation phase. We'll focus on the crucial jump from understanding the business problem to preparing the data to solve it.
From Business Goal to Technical Task
The first step, Business Understanding, is about translation. Stakeholders rarely ask for a predictive model directly. They have business objectives, like "we need to reduce customer churn."
Your job is to convert that vague goal into a precise data mining task. For churn reduction, the technical goal becomes building a binary classification model. This model will predict, for each customer, one of two outcomes: 'will churn' or 'will not churn'. This reframing is critical because it defines the kind of data, algorithms, and evaluation metrics you'll need.
A key part of this translation is defining success. How much churn reduction is enough? A 5% decrease? A 10% decrease? Establishing a measurable success criterion upfront prevents ambiguity later and tells you when your model is 'good enough' for deployment.
Advanced Data Preparation
Data preparation is often the most time-consuming phase, taking up to 80% of a project's timeline. It's where you confront the messy reality of real-world data. Your goal is to create a clean, high-quality dataset. This involves assessing completeness, identifying noise, and handling outliers.
While you might have used simple techniques like filling missing values with the column's mean or median before, these methods can distort the data's underlying patterns. More sophisticated techniques are needed for professional work.
Imputation
noun
The statistical process of replacing missing data with substituted values. The goal is to create a complete dataset that can be used for analysis without discarding valuable data points.
Instead of using a simple average, advanced imputation methods use other features in the dataset to make a more intelligent guess for the missing value.
One powerful method is MICE (Multivariate Imputation by Chained Equations). MICE works by creating a model for each variable with missing values, using all the other variables as predictors. It cycles through these models, updating its imputations in each round until the values stabilise. This approach preserves the relationships between variables, leading to more accurate and less biased results.
Another common approach is K-Nearest Neighbours (KNN) Imputation. Think of it like finding a data point's closest friends. To fill a missing value for a specific data point (e.g., a customer), the KNN algorithm identifies the 'K' most similar data points in the dataset based on their other features. It then uses the average value of that feature from these 'neighbours' to fill in the blank. This is effective because it uses local patterns in the data to make an informed guess.
Detecting Noise and Outliers
Not all strange-looking data is the same. An outlier might be a legitimate but rare data point (e.g., a customer who spends 100 times more than average), while noise is often a random error or corruption in the data (e.g., a data entry typo). Your job is to distinguish between them.
One basic way to spot potential outliers is with a Z-score, which tells you how many standard deviations a data point is from the mean.
A common rule of thumb is to investigate any data point with a Z-score above 3 or below -3. However, Z-scores are sensitive to extreme outliers themselves. If one outlier is very far from the mean, it will inflate the standard deviation, making other outliers harder to detect.
For a more robust approach, you can use an Isolation Forest. This is a machine learning algorithm specifically designed for anomaly detection. It works by building a series of random decision trees. The core idea is that outliers are easier to 'isolate' from the rest of the data than normal points. In a tree, an outlier will likely have a much shorter path from the root to its leaf node. The algorithm flags data points that are consistently isolated with few splits across many trees.
By the end of the data preparation phase, you should have a clean dataset and a clear report on its quality. This Data Quality Report is essential. It documents any issues found (like missing data or outliers), how they were handled, and justifies the decisions made. This transparency is crucial for the project's integrity and for anyone who might work with the data in the future.
In the CRISP-DM framework, which phase immediately follows Data Understanding?
A business objective is to 'reduce customer churn'. During the Business Understanding phase, what is the most direct translation of this goal into a data mining task?
With a well-defined technical goal and a prepared dataset, you're ready to move on to the next phase: Modeling.