Data Driven Strategic Decision Making for Analytics Leaders
Behavioral Decision Foundations
The Rational Ideal vs. Human Reality
In a perfect world, every business decision would stem from a clean, logical process. This is the core idea behind Rational Choice Theory. It assumes that individuals, armed with complete information, act to maximize their own self-interest. They weigh the costs and benefits of every option and select the one that offers the highest expected utility. As a data analyst, your models often operate on this principle, seeking the optimal solution based on the available data.
Rational Choice Theory posits that decision-makers are like flawless calculators, always choosing the path that leads to the greatest personal gain.
But we know people aren't flawless calculators. We operate with limited time, fuzzy information, and finite mental processing power. This is where the model starts to break down. Our decisions are influenced by biases, emotions, and the sheer complexity of the world around us. Acknowledging this gap between the ideal and the real is the first step toward making more robust, human-centered data interpretations.
Good Enough Is the New Perfect
In the 1950s, economist and psychologist Herbert Simon introduced a revolutionary concept: bounded rationality. He argued that people don't search for the single best, or optimal, solution. Instead, we seek an option that is simply “good enough.” He called this behavior “satisficing”—a blend of sufficing and satisfying.
Satisfice
verb
To accept an available option as satisfactory, rather than searching for the absolute best or optimal choice.
Think about choosing a new software vendor for your team. A purely rational approach would involve identifying every possible vendor in the market, exhaustively comparing them on hundreds of features, and modeling their long-term financial impact. This is impossible. Instead, you'll likely review a few well-known options, find one that meets your critical needs and budget, and make a decision. You satisfice.
For a data analyst, this means your stakeholders won't always choose the strategy your model identifies as statistically optimal. They might pick a less optimal but more easily implemented alternative. They are operating within the bounds of their own rationality, constrained by corporate politics, departmental budgets, and personal experience.
How We Really Weigh Risk
The next layer of complexity comes from , developed by Daniel Kahneman and Amos Tversky. This theory describes how people make decisions under uncertainty, and it shatters the idea that we treat gains and losses equally. Its central finding is loss aversion: the psychological pain of losing something is about twice as powerful as the pleasure of gaining the equivalent amount.
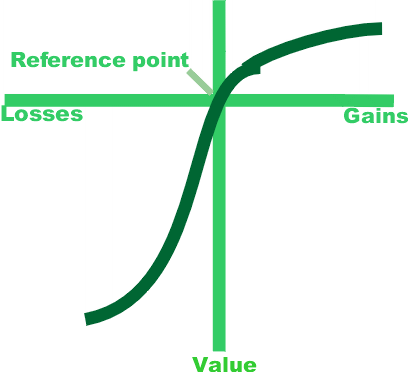
This leads to some predictable, yet irrational, behaviors. People will often take bigger risks to avoid a loss than they would to secure a gain. Imagine you're presenting two investment strategies for a new product launch:
- Strategy A: A guaranteed profit of $1 million.
- Strategy B: A 90% chance of making $1.2 million, and a 10% chance of making nothing.
Many executives would choose the certain gain of Strategy A, even though Strategy B has a higher expected value ($1.08 million). They are risk-averse when it comes to gains.
Now consider the framing. What if the choice was about losses?
- Strategy C: A guaranteed loss of $1 million.
- Strategy D: A 90% chance of losing $1.2 million, and a 10% chance of losing nothing.
Here, many would choose Strategy D. The small hope of avoiding a loss makes them risk-seeking. The framing of the problem—as a gain or a loss—radically changes the decision, even when the underlying numbers are similar. As an analyst, how you frame your findings can significantly influence the decision that gets made.
Thinking Fast and Slow
Kahneman further popularized the idea of two distinct modes of thought: System 1 and System 2. is our fast, intuitive, and emotional brain. It operates automatically and is responsible for gut reactions and recognizing patterns. System 2 is the slow, deliberate, and logical brain. It's what you use to solve a complex math problem or analyze a dense dataset.
Data analysis is primarily a System 2 activity. However, both you and your stakeholders are constantly influenced by System 1. When you see a spike in a chart, your System 1 might immediately jump to a conclusion before your System 2 has a chance to rigorously test the hypothesis. Your stakeholders might reject a statistically sound recommendation because it just “doesn’t feel right” to their System 1 intuition.
Your role is to be the champion of System 2 thinking. This means consciously questioning your initial interpretations of the data, designing analyses that challenge your own assumptions, and presenting findings in a way that helps your audience move past their gut reactions and engage with the evidence logically.
Now let's apply these concepts in a practical scenario.