Data Analytics in Practice
Strategy and Data Architecture
From Business Problem to Data Plan
A business goal often starts as a simple, vague question. "Why are we losing customers?" or "How can we increase sales?" These are important questions, but you can't point a database at them. The first step in any analysis is to translate these broad objectives into specific, measurable questions.
This translation process is called analytical thinking. It's about breaking down a big problem into smaller pieces that data can actually address. For instance, "Why are we losing customers?" becomes:
- What is the monthly churn rate for customers on our premium plan?
- Which user actions in the 30 days before cancellation correlate most strongly with churn?
- Do customers who contact support have a lower or higher churn rate?
Each of these questions points toward specific data points: subscription plans, dates, user activity logs, and support tickets. Suddenly, the vague problem has a concrete data footprint. This is the bridge from business strategy to data architecture.
The goal is to reframe a business problem as a series of questions that, if answered, would provide a clear path to a solution.
Systems for Doing vs. Systems for Deciding
Not all data systems are built for the same purpose. The database that runs a company's website is fundamentally different from the system used to analyze its performance. Understanding this distinction is key to building an effective analytical workflow.
Day-to-day operations are handled by Online Transactional Processing (OLTP) systems. Think of the database that processes your credit card payment or records an order. It's designed for speed and efficiency, handling thousands of small, simple transactions per second. It needs to write and update data very quickly and reliably.
Business analysis, on the other hand, relies on Online Analytical Processing (OLAP) systems. These are built to answer complex questions that involve reading huge amounts of historical data. Think of a query that calculates the average customer lifetime value across all regions for the past five years. This kind of work would grind an OLTP system to a halt.
Because of these different jobs, we rarely perform heavy analysis directly on an OLTP system. Doing so would be like asking a cashier to stop ringing up customers to go count all the money in the vault. Instead, data is regularly moved from one or more OLTP systems into a staging environment and then into a data warehouse built for OLAP.
| Feature | OLTP (Transactional) | OLAP (Analytical) |
|---|---|---|
| Primary Goal | Run the business | Analyze the business |
| Data | Current, real-time | Historical, aggregated |
| Operations | Fast writes, simple reads | Complex reads, few writes |
| Users | Front-line workers, customers | Analysts, data scientists |
| Example | E-commerce checkout | Quarterly sales report |
This separation is critical. It protects the performance of the operational systems while giving analysts a dedicated playground optimized for asking deep, complex questions.
Modeling Data for Analysis
Once data is in an analytical system, its structure determines how easy it is to query. For analysis, data is often organized into schemas that are different from the highly normalized structures used in OLTP systems. The two most common analytical schemas are the star schema and the snowflake schema.
The goal of both is to organize data around business events or objects. At the center is a fact table. This table contains the quantitative measures of the business process, like sales amount, units sold, or number of clicks. It's surrounded by dimension tables, which contain the descriptive attributes that provide context to the facts, such as customer names, product categories, or dates.
Understand different modeling techniques like star schema, snowflake schema, and data vault to build robust models that support complex queries efficiently.
In a star schema, the fact table links directly to each of its dimension tables. The structure looks like a star, with the fact table at the center and the dimensions radiating outwards. This design is simple, fast for queries, and easy to understand. Because the dimensions are denormalized (meaning they contain some redundant data to avoid joins), the query performance is excellent.
The snowflake schema is an extension of the star schema. Here, the dimension tables are normalized into multiple related tables. For example, a DimProduct table might be broken down into DimProduct, DimBrand, and DimCategory tables. This reduces data redundancy and can simplify data maintenance, but it comes at a cost. Queries require more joins, which can make them slower and more complex to write.
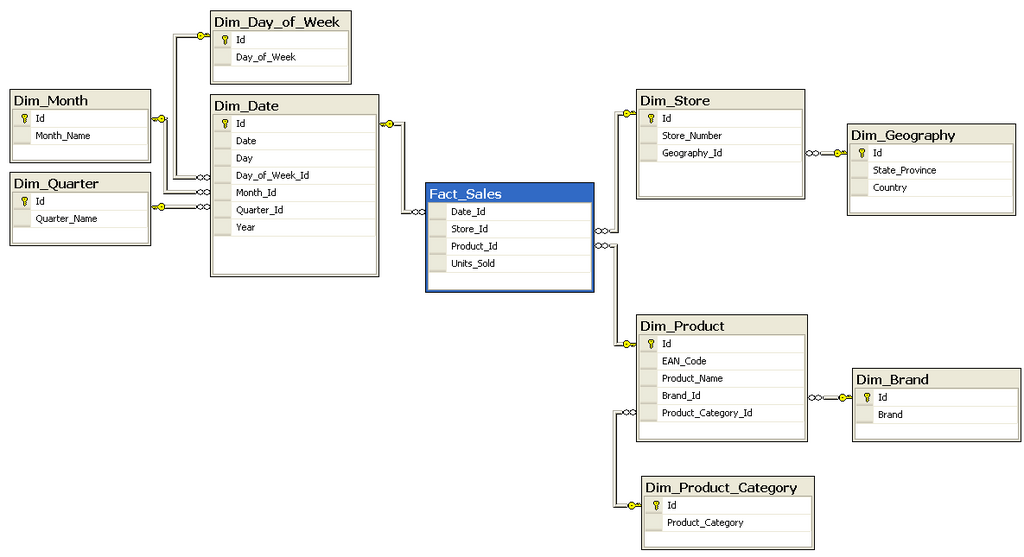
Choosing between them involves a trade-off: a star schema prioritizes query performance and simplicity, while a snowflake schema prioritizes storage efficiency and data integrity. For most analytical purposes, the simplicity and speed of the star schema are preferred.
Designing for Quality
The phrase "Garbage In, Garbage Out" is a cliché for a reason. Poor quality data leads to unreliable analysis. However, this isn't just a cleaning problem—it's a design problem. A robust data collection framework is your first line of defense against bad data.
Designing for quality means thinking about potential issues before they happen. For example, when collecting user sign-up information:
- Use dropdowns instead of free-text fields for data like country names to prevent typos and variations ('USA', 'U.S.A.', 'United States').
- Implement validation rules at the point of entry to ensure email addresses are correctly formatted or that zip codes contain the right number of digits.
- Establish clear data ownership and definitions. Everyone in the organization should agree on what a "customer" or an "active user" is. This prevents confusion and ensures metrics are calculated consistently.
By building quality control directly into the data collection and architecture, you minimize the amount of cleaning and transformation needed later. This saves time and, more importantly, builds trust in the data and the insights derived from it.
Which of the following best exemplifies the process of translating a broad business objective into a specific, measurable analytical question?
What is the primary function of an Online Analytical Processing (OLAP) system?
Bridging the gap between a business goal and a functional data architecture is a strategic process. It involves translating vague questions into specific analytical requirements, choosing the right system (OLAP) and schema (star or snowflake) for the job, and designing a collection process that ensures data quality from the very beginning.