Data Analyst Career Starter
Data Analysis Foundations
Turning Facts into Insights
Think about your last grocery receipt. It’s a list of items, prices, and a total. On its own, it’s just a bunch of facts. But what if you collected a year's worth of these receipts? You might see patterns. Maybe you buy more ice cream in the summer or spend more on weekends. That’s data analysis in a nutshell: taking raw facts, or data, and turning them into useful insights.
Data
noun
A collection of facts, such as numbers, words, measurements, observations or just descriptions of things.
Data can be anything from the number of steps you walk in a day to the list of songs in your favorite playlist. Data analysts look at this information to answer questions and solve problems. A business might want to know its most popular product, or a city might want to understand traffic flow to reduce congestion. By analyzing data, they can make smarter, evidence-based decisions.
The Data Life Cycle
Data doesn't just magically provide answers. It goes through a process, often called the data life cycle. This cycle has a few key stages that turn raw numbers into a clear story.
Here's what happens at each stage:
- Collect: This is where data is gathered. It could come from customer surveys, sales reports, website clicks, or public sources like government databases.
- Clean: Raw data is often messy. It might have duplicates, errors, or missing information. The cleaning stage involves fixing these issues to make the data reliable and ready for analysis.
- Analyze: This is the discovery phase. Analysts use tools to explore the data, look for patterns, and test ideas. The goal is to find the story the data is trying to tell.
- Share: Insights are only valuable if they're shared. Analysts present their findings to others, often using charts and graphs to make the story clear and compelling. This helps decision-makers understand the situation and take action.
Who Works with Data?
Many different professionals work with data, but two of the most common roles are Data Analyst and Data Scientist. While their jobs overlap, they have different primary focuses.
A data analyst’s job is two-fold; the way you read and understand data is often more complex and technical than how you’ll want to explain to non-data analysts.
A Data Analyst primarily looks at past data to explain what happened and why. They answer business questions like, "Which marketing campaign brought in the most new customers last quarter?" Their work is focused on understanding the present and recent past to inform current strategy.
A often builds on this work. They use complex statistical methods and machine learning to make predictions about the future. They might answer questions like, "Which potential customers are most likely to buy our new product next year?"
| Role | Focus | Key Question |
|---|---|---|
| Data Analyst | Explaining the past and present | "What happened?" |
| Data Scientist | Predicting the future | "What might happen?" |
Structured vs. Unstructured Data
Data comes in all shapes and sizes. The two main categories are structured and unstructured.
Structured data is highly organized and easy to search. Think of a spreadsheet, like a list of contacts with neat columns for Name, Phone Number, and Email. The format is predictable, which makes it simple for computers to work with.
is everything else. It doesn't have a predefined model. Examples include the text of an email, a photo, a video file, or a social media post. It's rich with information but much harder to analyze without special tools and techniques.
Most of the data in the world is unstructured. The challenge and opportunity for analysts is to find ways to give it structure so it can be understood.
Making an Impact
The real goal of data analysis is to drive change. Imagine a small coffee shop that wants to increase its morning sales. The owner tracks purchases for a month and notices that while many people buy coffee, very few buy pastries before 10 a.m.
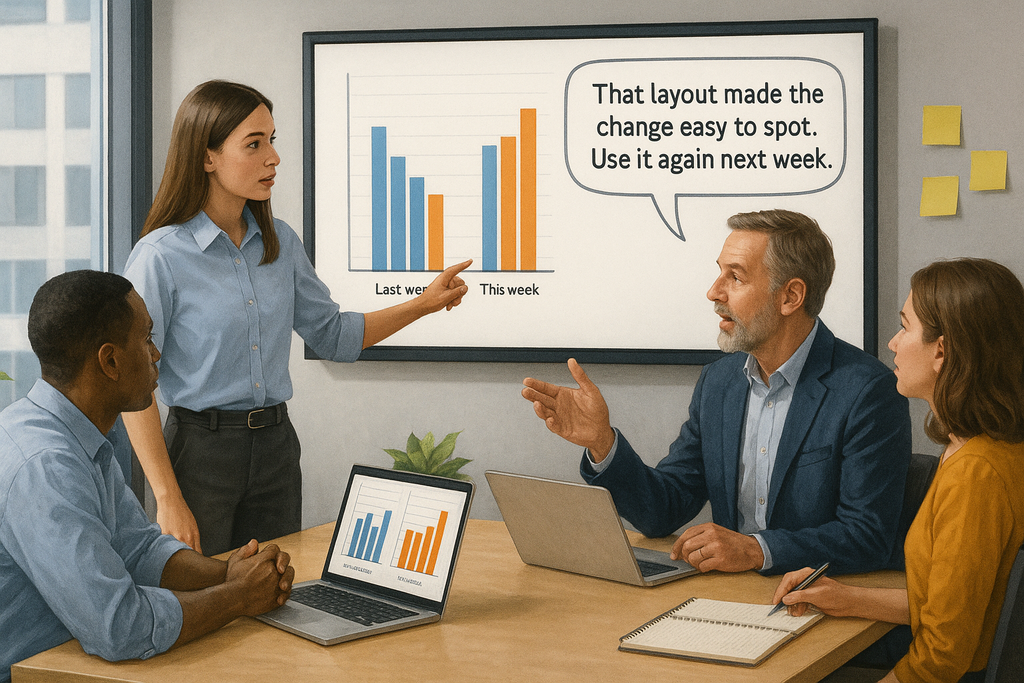
Based on this data, the owner decides to run an experiment: a "coffee and croissant" combo deal, but only available until 10 a.m. They track the sales data for another month and see a huge jump in pastry sales. The data didn't just provide an interesting fact; it led to a specific action that achieved a business goal.
This simple example shows the power of data. From small shops to global companies, data analysis helps people move from guessing to knowing, allowing them to make better decisions backed by real evidence.
What is the primary goal of data analysis?
During which stage of the data life cycle are errors, duplicates, and missing information corrected?
This is just the beginning of the journey. The core idea is simple: data provides the clues, and analysis is the detective work used to solve the puzzle.