Crypto Trend Following Across Timeframes
Introduction to Trend Following
What Is Trend Following?
Trend following is a trading strategy based on a simple idea: buy assets that are going up and sell assets that are going down. Instead of trying to predict market tops or bottoms, trend followers react to what the market is actually doing. The core belief is that once a price trend is established, it's likely to continue for some time.
The classic trading mantra, "The trend is your friend," sums up this entire philosophy.
This approach isn’t about forecasting or complex economic analysis. It’s a reactive strategy that uses price action to make decisions. When a clear upward trend is identified, a trader buys. They hold the position as long as the trend continues and sell when the trend shows signs of reversing. The same logic applies in reverse for a downward trend.
Trends in Cryptocurrency
Cryptocurrency markets are a unique playground for trend followers. Two key characteristics make them stand out: high volatility and 24/7 trading hours.
High volatility means prices can move dramatically in short periods. While this brings risk, it also creates strong, clear trends that can be very profitable if you're on the right side of them. A slow, quiet market offers few opportunities for trend followers, but the crypto market is rarely quiet.
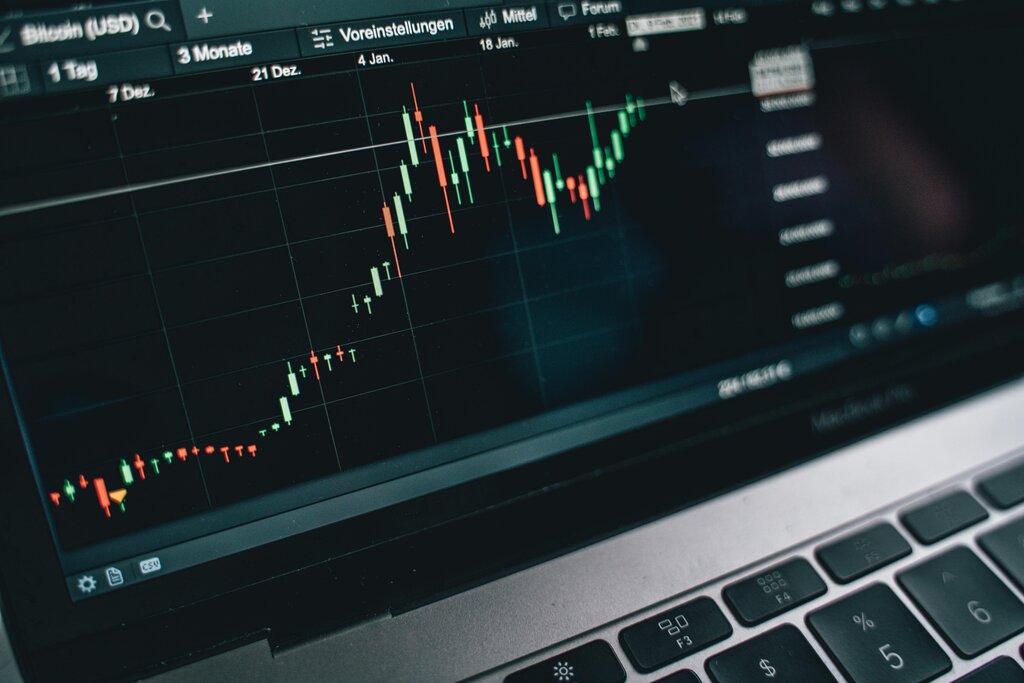
Unlike traditional stock markets that open and close, the crypto market never sleeps. This constant activity means trends can develop and play out at any hour of any day. A trend that starts on a Friday afternoon can continue building momentum all weekend.
Tools for Identifying Trends
To follow a trend, you first have to see it. The most basic way to identify a trend is by looking at the peaks and troughs of the price chart.
- Uptrend: A series of higher highs (peaks) and higher lows (troughs).
- Downtrend: A series of lower highs and lower lows.
While looking at highs and lows is fundamental, traders often use technical indicators to help smooth out price data and make trends easier to spot. One of the most common tools for this is the moving average.
Moving Average
noun
A technical indicator that smooths out price data by creating a constantly updated average price. It is calculated over a specific number of past periods, like 20 days or 50 hours.
A moving average line on a chart helps filter out the random, short-term price fluctuations, or "noise." It gives a clearer view of the underlying trend direction. When the price is consistently trading above its moving average, it’s a sign of an uptrend. When it’s below, that suggests a downtrend.
Moving averages are a foundational tool. By observing the relationship between the price and its moving average, traders can make more objective decisions about when to enter or exit a position based on the trend's strength and direction.
Now let's test what you've learned.
What is the core philosophy of a trend-following strategy?
According to the text, which two characteristics of cryptocurrency markets make them particularly well-suited for trend following?
Understanding these core principles is the first step. Trend following isn't about being right every time, but about capitalizing on sustained market movements when they occur.