Celestial Mechanics and Galactic Evolution
Electromagnetic Radiation Analysis
Decoding Starlight
For an astronomer, the light from a distant star isn't just a point of brightness in the sky. It's a stream of data carrying detailed information across trillions of miles. By splitting this light into its constituent wavelengths, a process called spectroscopy, we can uncover a star's chemical makeup, temperature, and even its motion. The key to this analysis lies in understanding three distinct types of spectra, first cataloged by Gustav Kirchhoff in the 19th century.
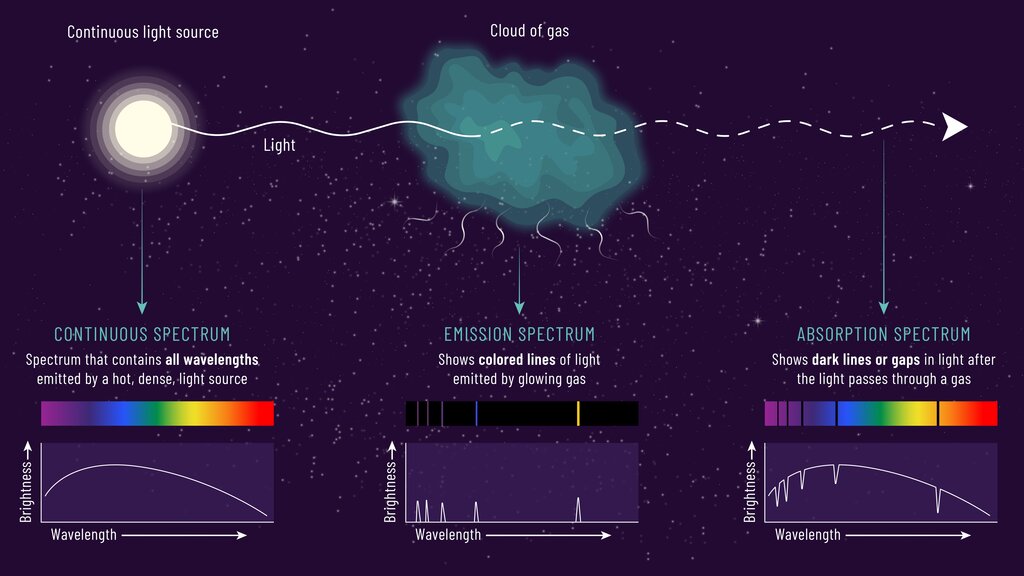
A hot, dense object like the core of a star emits a continuous spectrum, a smooth rainbow of all colors. If we observe a hot, low-density gas cloud on its own, we see an emission spectrum, which consists of bright lines at specific wavelengths against a black background. These bright lines correspond to the energy that electrons release as they drop to lower energy levels.
However, the most common spectrum we see from stars is an absorption spectrum. This occurs when light from a continuous source passes through a cooler, overlying gas, like a star's atmosphere. The atoms in the cooler gas absorb photons at the exact same wavelengths they would otherwise emit, creating dark lines in the otherwise continuous spectrum. Each element has a unique pattern of these lines, a sort of cosmic barcode that allows us to identify it from light-years away. This is the foundation of of radiation.
The Cosmic Speedometer
Spectral lines don't just tell us what a star is made of; they also tell us how it's moving. This is thanks to the Doppler effect, the same principle that makes an ambulance siren change pitch as it passes you. When a light source moves toward an observer, its light waves get compressed, shifting its spectral lines toward shorter, bluer wavelengths. This is called a blueshift. When a source moves away, its light waves are stretched out, shifting its lines toward longer, redder wavelengths, a phenomenon known as .
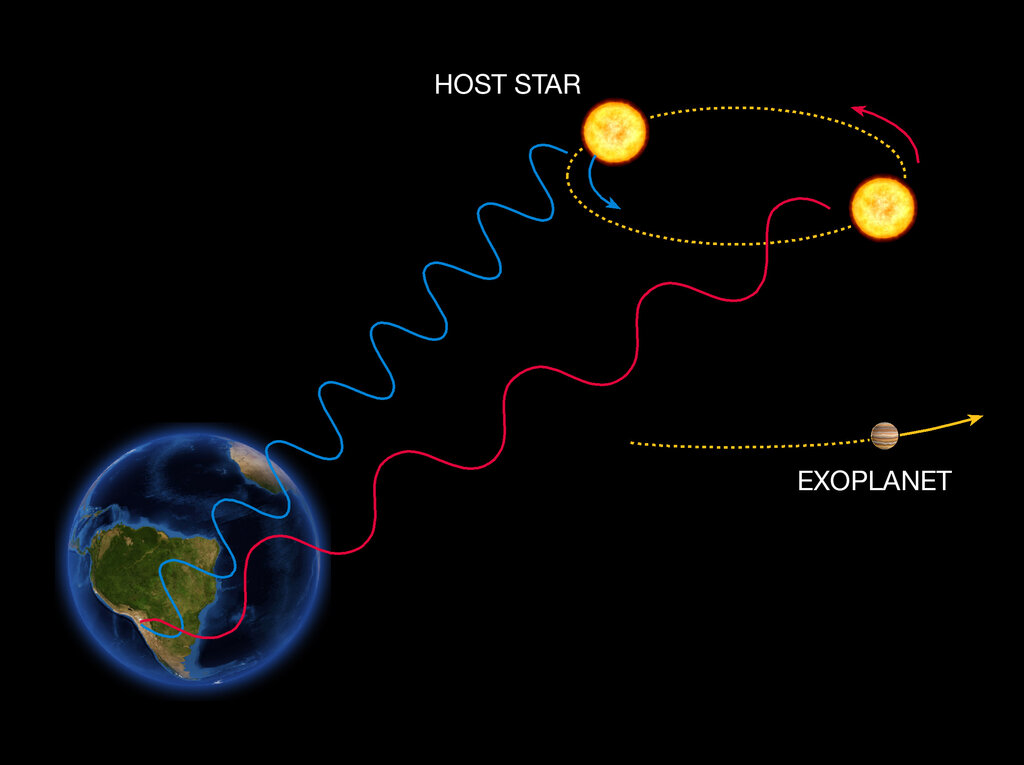
By measuring the precise amount of this shift, we can calculate an object's radial velocity, or its speed directly toward or away from us. The change in wavelength () compared to the original, or rest, wavelength () is directly proportional to the radial velocity () relative to the speed of light ().
More Than Just Lines
While spectroscopy breaks light into a fine-toothed comb of wavelengths, photometry measures the total amount of light, or flux, received from an object. This can be done across the entire spectrum or, more commonly, through specific filters that isolate a range of wavelengths. Broadband photometry uses wide filters (like U, B, V for ultraviolet, blue, and visible) to get a general sense of a star's color and temperature. Narrowband photometry uses very specific filters to isolate a single spectral line, often to study a particular physical process, like hydrogen emission in a nebula.
Photometry tells us 'how much' light, while spectroscopy tells us 'what kind' of light.
Looking closely, spectral lines are not infinitely sharp. They are broadened by several physical mechanisms. Natural broadening is a fundamental consequence of the uncertainty principle. Thermal broadening occurs because atoms in a gas are moving randomly; some are moving toward us (blueshifted) and some away (redshifted), smearing the line out. Finally, pressure broadening happens in dense environments where collisions between atoms disturb their energy levels, widening the range of absorbed or emitted photon energies.
By analyzing the shape of these broadened lines, astronomers can infer the temperature, pressure, and even rotation speed of a star's atmosphere. This detailed information allows us to build a complete physical picture of an object we can never hope to visit.