Causal and Bayesian Models in Cognition
Introduction to Causal Models
Beyond Just 'What' to 'Why'
We often notice patterns in the world. For example, when students study more, their grades tend to improve. When it rains, more people carry umbrellas. These are simple observations about what happens. But often, we want to know why something happens. This is where causal models come in.
A causal model is a tool that helps us represent and understand cause-and-effect relationships. Instead of just noting that two things happen together, a causal model tries to show how one thing directly or indirectly causes another. It's like a blueprint for a piece of reality, showing how the different parts influence each other.
A fundamental goal of scientific research is to learn about causal relationships.
Think of it as the difference between a weather report and a meteorology textbook. The report tells you it’s raining (the what), while the textbook explains the atmospheric processes that lead to rain (the why). Causal models help us move from observation to understanding.
Correlation Is Not Causation
You've probably heard this phrase before, and it’s the cornerstone of causal thinking. Just because two things change at the same time, it doesn't mean one causes the other. This is called a correlation.
Here’s a classic example: in summer, ice cream sales and the number of drowning incidents both increase. The two are strongly correlated. But does eating ice cream cause people to drown? Of course not. There's a third factor at play: hot weather. Hot weather causes more people to buy ice cream and causes more people to go swimming, which unfortunately leads to more drowning incidents. This hidden third factor is called a confounding variable.
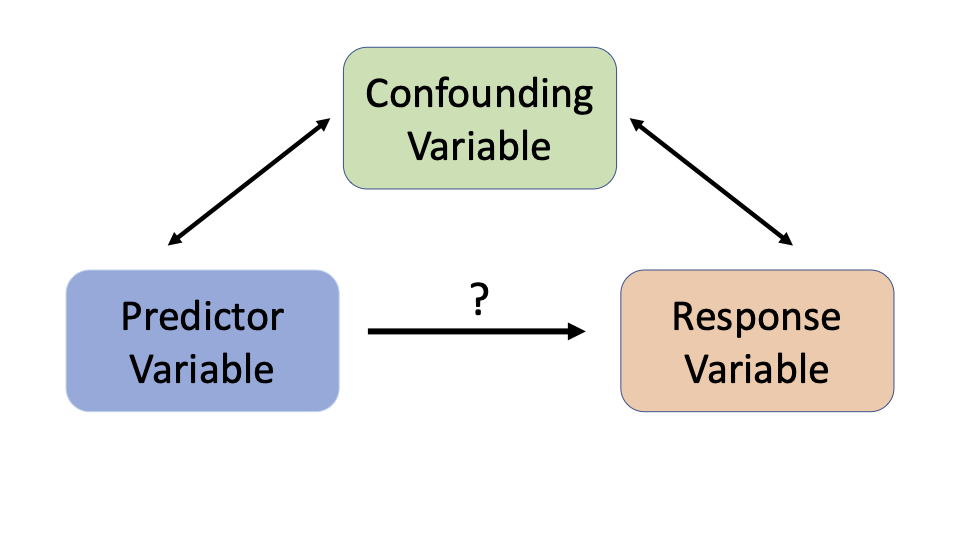
Failing to see the confounder can lead to bad conclusions. If we thought ice cream caused drowning, we might ban ice cream sales to save lives, which would be ineffective and just make summer less enjoyable. Understanding the true causal structure is essential for making good decisions.
Drawing the Connections
To untangle these relationships, we can use causal diagrams. These are simple maps that show our assumptions about what causes what. In these diagrams, we use nodes (often circles or boxes) to represent variables and arrows to represent causal links.
An arrow from A to B means we believe A causes B. Let's map our summer example.
This diagram makes our hypothesis clear: hot weather is the common cause of both increased ice cream sales and drownings. There is no arrow between ice cream and drowning because we don't believe they have a direct causal link. These diagrams, formally known as Directed Acyclic Graphs (DAGs), force us to be explicit about our assumptions.
From Diagrams to Equations
A diagram is a great way to visualize a causal theory, but how do we test it with data? That’s where structural equation modeling (SEM) comes in. SEM is a statistical framework for testing and estimating causal relationships using a combination of statistical data and causal assumptions (our diagram).
In essence, SEM translates the arrows in our causal diagram into a set of mathematical equations. Each equation represents a causal link and estimates the strength of that relationship. For example, if we have a simple model where study time affects grades, we might write an equation like this:
In this equation, the coefficient (beta) represents the strength and direction of the effect of Study Time on Grades. The (epsilon) term represents all other factors that might influence grades that aren't in our model, like random chance or unmeasured variables.
By fitting this model to actual student data, we can estimate the value of and see how well our proposed causal structure explains the real-world pattern. It's a powerful way to move from a theoretical drawing to a quantitative test of our ideas.
Ready to check your understanding?
What is the primary purpose of a causal model?
A city finds that the number of fire trucks at a fire is strongly correlated with the amount of damage caused. What is the most likely explanation?
Causal models provide a powerful framework for asking 'why'. By distinguishing correlation from causation and using tools like diagrams and SEM, we can build and test more accurate theories about how the world works.