Calculus I Fundamentals
Functions and Graphs
What is a Function?
Think of a function as a simple machine. You put something in, and you get something out. For example, a coffee grinder is a function: you put in coffee beans (the input), and you get out coffee grounds (the output). In math, a function is a rule that takes an input number and gives you back exactly one output number.
function
noun
A relation between a set of inputs and a set of permissible outputs with the property that each input is related to exactly one output.
We usually write functions as , which you read as "f of x". Here, is the input, and is the output. For the function , if you input a 3, the output is . Simple as that.
Every function has two important sets of values associated with it.
domain
noun
The complete set of possible input values for a function.
range
noun
The complete set of all possible resulting output values of a function.
How can you tell if a graph represents a function? Use the vertical line test. If you can draw a vertical line anywhere on the graph and it only ever crosses the curve once, you're looking at a function. If it hits the curve more than once, it's not a function because one input would have multiple outputs.
Transforming Graphs
You don't need to plot every function from scratch. Once you know the shape of a basic function, like , you can move it around, stretch it, or flip it to create new graphs. These changes are called transformations.
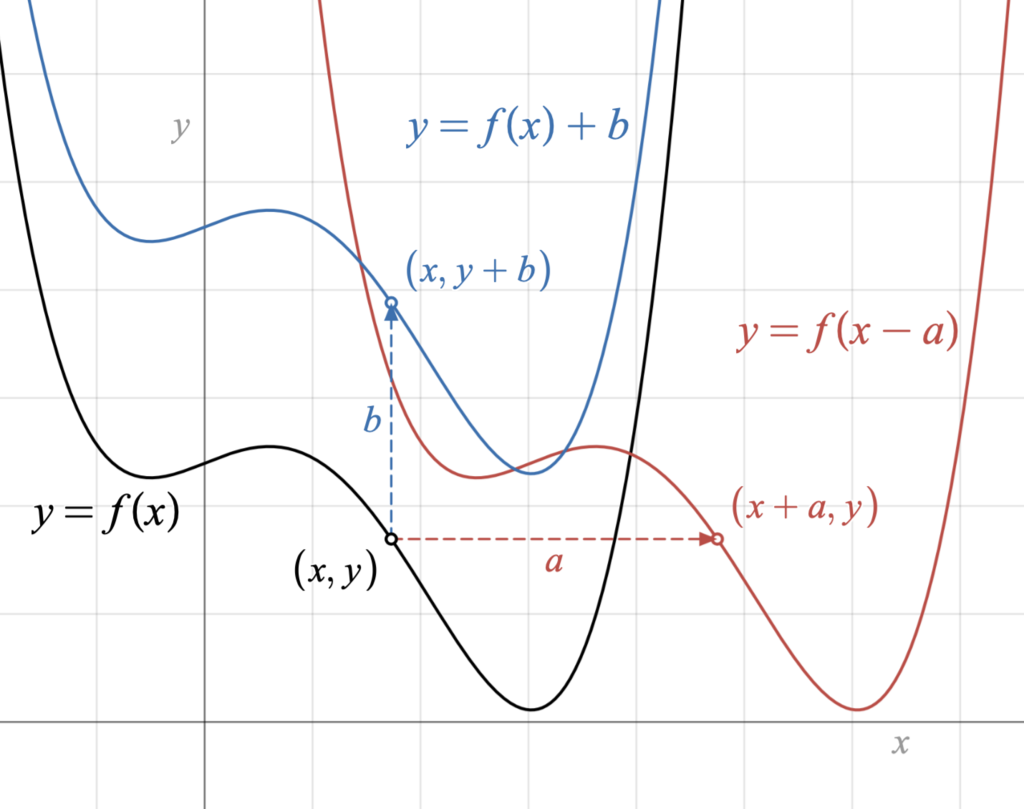
Shifting a graph is simple. To move it up or down (a vertical shift), you add or subtract a number from the whole function. To move it left or right (a horizontal shift), you add or subtract a number from the variable itself.
We can also stretch, compress, or reflect graphs. Multiplying the entire function by a number stretches or compresses it vertically. If that number is negative, it also flips the graph over the x-axis.
Common Function Families
While there are infinitely many functions, most fall into a few key families. Understanding these basic types is crucial because they appear everywhere in calculus and the real world.
Polynomial Functions
Polynomials are built from variables raised to non-negative integer powers, like . The highest power is called the "degree" of the polynomial.
- Degree 1: Linear functions, like . Their graphs are straight lines.
- Degree 2: Quadratic functions, like . Their graphs are U-shaped parabolas.
- Degree 3: Cubic functions, like . Their graphs are S-shaped curves.
Exponential and Logarithmic Functions
Exponential functions, like , model things that grow or shrink very quickly, such as population growth or radioactive decay. The variable is in the exponent. Their graphs shoot upwards rapidly or decline towards zero.
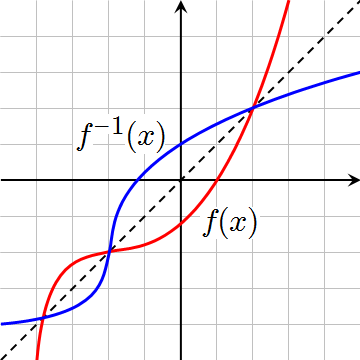
Logarithmic functions, like , are the inverses of exponential functions. They answer the question: "what exponent do I need to get this number?" For example, because . Their graphs start steep and then flatten out.
Trigonometric Functions
Trigonometric functions describe relationships in triangles, but their real power comes from modeling periodic, or repeating, phenomena. Think of waves in the ocean, sound waves, or the rotation of a Ferris wheel.
The most common are sine (), cosine (), and tangent (). Sine and cosine produce smooth, repeating waves. Tangent is also periodic, but its graph has vertical asymptotes, or lines it never crosses.
Now that you've seen the basic building blocks, let's test your understanding of these functions and their graphs.
Given the function , what is the value of ?
Which of the following describes the graph of a quadratic function, such as ?
Getting comfortable with these function families and how to manipulate their graphs is a fundamental skill for calculus. It allows you to visualize complex problems and understand the behavior of different mathematical models.