Calculus Fundamentals
Functions and Graphs
What is a Function?
Think of a function as a simple machine. You put something in, and it spits something out. What makes it special is its consistency: for any specific input, you always get the exact same output. The function has a rule it follows every single time.
For example, a function might have the rule "double whatever you put in and then add three." If you put in the number 2, the function doubles it to 4 and adds 3, giving you 7. If you put in 2 again, it will give you 7 again. It will never surprise you and give you 8.
The core rule of a function: every input has exactly one output.
We often write functions using a special notation. If we call our function , we'd write the rule as . Here, is the placeholder for our input. The notation represents the output for a given . So, means "the output of function when the input is 2."
Domain and Range
Every function has two important sets of values associated with it: its domain and its range.
domain
noun
The set of all possible input values for a function.
The domain is what you're allowed to put into the function. For our machine , we can plug in any real number we want. But what about a function like ? Since we can't take the square root of a negative number (in the real number system), its domain is all non-negative numbers, which we write as .
range
noun
The set of all possible output values for a function.
The range is all the possible results the function can give you. For , the outputs can be any real number, so its range is all real numbers. For , the output can never be negative. The smallest it can be is 0 (when ). So, its range is all non-negative numbers, or .
Visualizing Functions
The best way to understand a function's behavior is to look at its graph. A graph plots every input-output pair on a coordinate plane. The horizontal axis (x-axis) represents the input (the domain), and the vertical axis (y-axis) represents the output (the range).
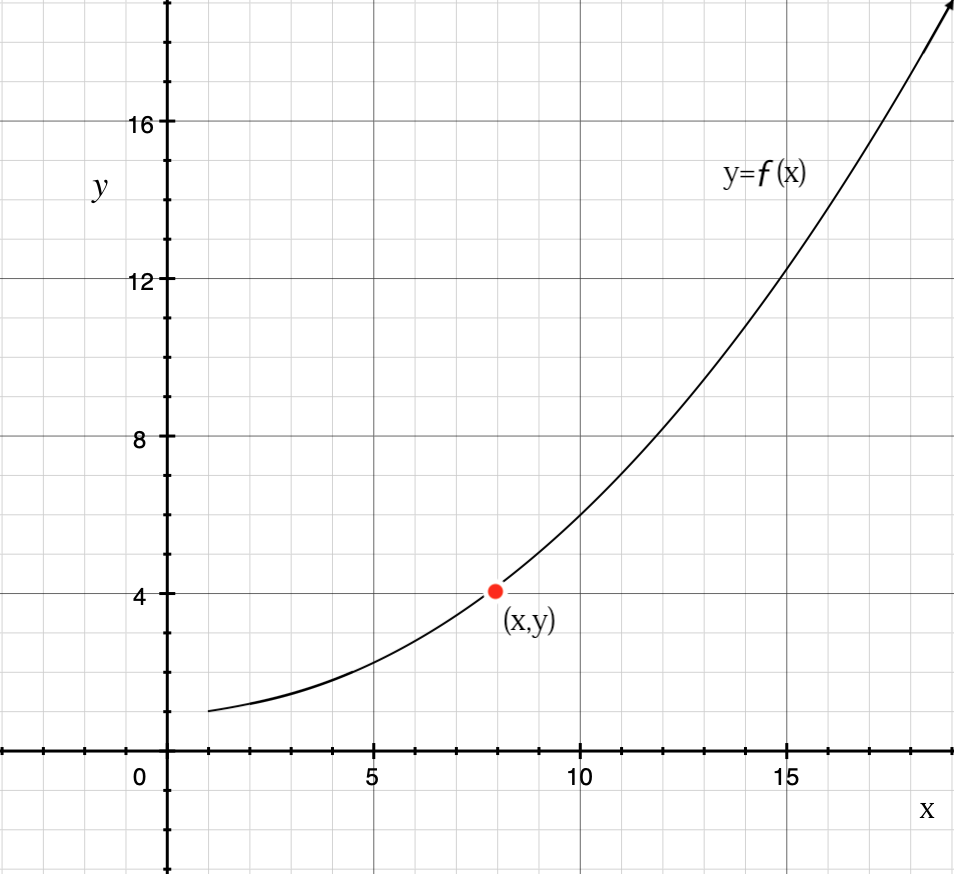
Remember the rule that every input has only one output? This leads to a simple visual check called the Vertical Line Test. If you can draw a vertical line anywhere on the graph and it crosses the function's curve more than once, it's not a function.
Explain to students that if a vertical line can be drawn and only intersects the graph at one point at a time, then the graph represents a function.
Graphs tell us a story. We can see where a function is increasing (going uphill as you move from left to right), decreasing (going downhill), or staying constant. We can spot its highest and lowest points and see where it crosses the axes.
A Family of Functions
Functions come in many varieties, each with its own characteristic shape and behavior. Here are a few of the most common types.
| Function Type | General Form | Description |
|---|---|---|
| Linear | Creates a straight line. | |
| Quadratic | Forms a U-shaped curve called a parabola. | |
| Polynomial | Smooth, continuous curves with turns. | |
| Exponential | Shows rapid growth or decay. | |
| Logarithmic | The inverse of an exponential function. | |
| Trigonometric | e.g., | Periodic, repeating waves. |
Getting familiar with the basic shapes of these functions is a huge advantage. When you see an equation like , you'll immediately know you're looking for a downward-facing parabola. When you see , you'll expect a curve that starts slow and then shoots upward dramatically.
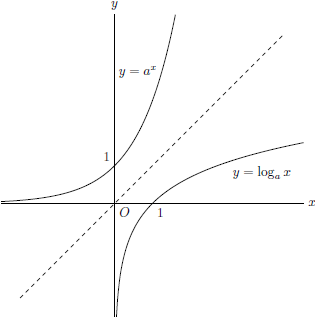
This ability to connect an equation to a visual shape is a cornerstone of calculus. It allows you to anticipate a function's behavior before you even start calculating.
Let's test your understanding of these core ideas.
What is the most fundamental rule that a relationship must follow to be considered a function?
Given the function , what is the value of ?
Understanding functions and their graphs is the first major step into the world of calculus. It's the language we'll use to describe change and motion.