Calculus Fundamentals
Functions and Graphs
What is a Function?
Think of a function as a simple machine. You put something in, it does something specific, and one thing comes out. For every unique input, you get exactly one output. Mathematicians call the input an independent variable (usually ) and the output a dependent variable (usually or ).
For example, in the function , if you put in a 3, you'll always get a 5. If you put in a 10, you'll always get a 12. You can't put in a 3 and sometimes get 5 and other times get 9.
Function
noun
A rule that assigns to each element in a set of inputs (the domain) exactly one element in a set of outputs (the range).
This one-to-one or many-to-one relationship is the key. You can have multiple inputs leading to the same output (like how both and give an output of 4 in the function ), but you can't have one input leading to multiple outputs.
When we graph functions, we use the vertical line test. If you can draw a vertical line anywhere on the graph and it only ever crosses the function's curve once, it's a valid function. If it hits the curve more than once, it's not.
Domain and Range
Every function has a domain and a range. The domain is the set of all possible inputs the function can accept. The range is the set of all possible outputs the function can produce.
For some functions, the domain is all real numbers. You can plug any number you want into and it will work. But for a function like , you can't use 0 as an input because division by zero is undefined. So, its domain is all real numbers except 0.
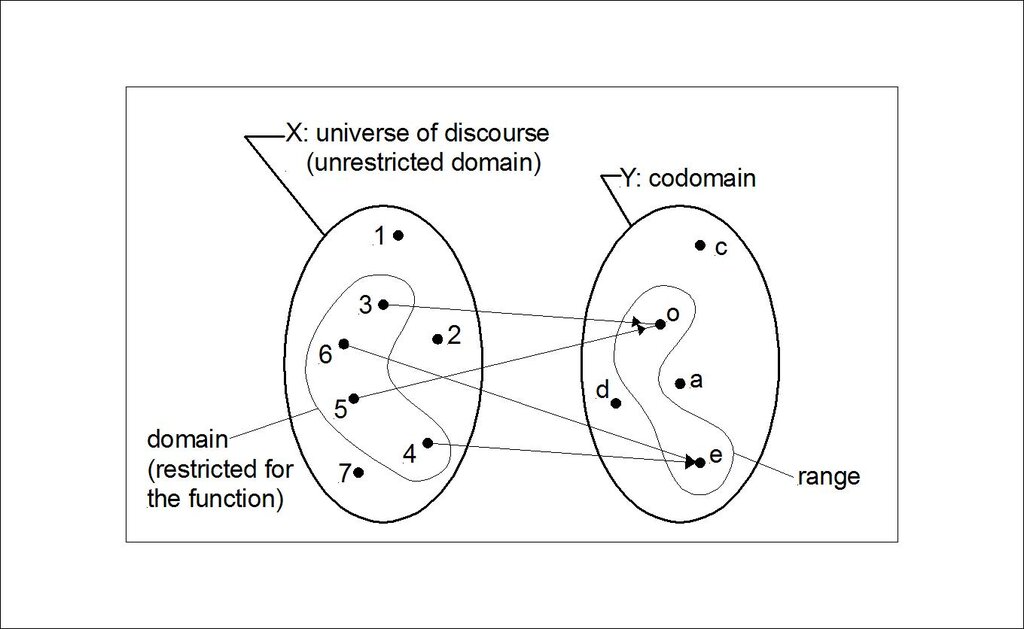
The range is determined by what the function does. For , the domain is all real numbers. But since squaring any number (positive or negative) results in a positive number or zero, the range is all non-negative numbers. You can never get an output of -5 from this function.
A Tour of Common Functions
Functions come in many flavors. Let's look at some of the most common types you'll encounter.
Linear Functions: These are the simplest. Their formula is and their graph is always a straight line. The value '' represents the slope (how steep the line is), and '' is the y-intercept (where the line crosses the vertical y-axis).
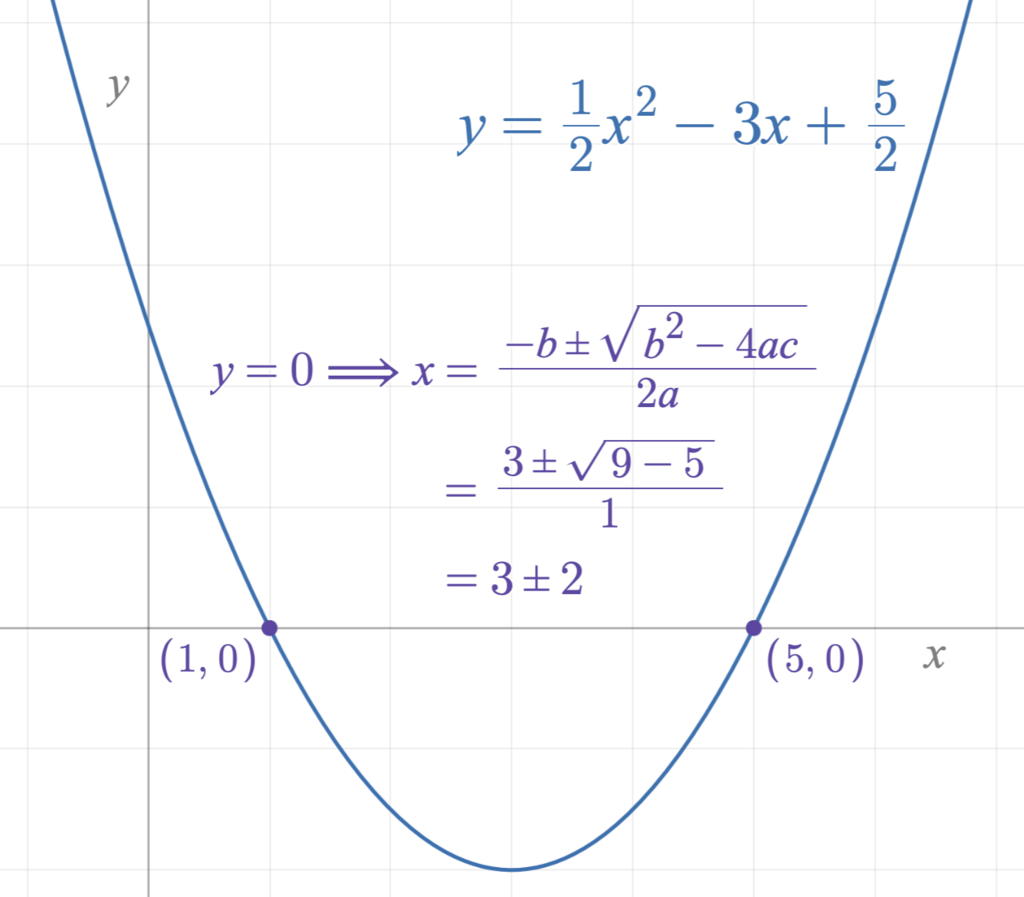
Quadratic Functions: These have the form . Their graphs are U-shaped curves called parabolas. They can open upwards or downwards depending on whether '' is positive or negative.
Polynomial Functions: These are a generalization of linear and quadratic functions, with the form . The highest power, , is called the degree of the polynomial. Their graphs are smooth, continuous curves that can have various twists and turns.
Rational Functions: These are ratios of two polynomials, like . Their graphs can be more complex and often have asymptotes, which are lines that the curve gets closer and closer to but never touches. The function is a simple example.
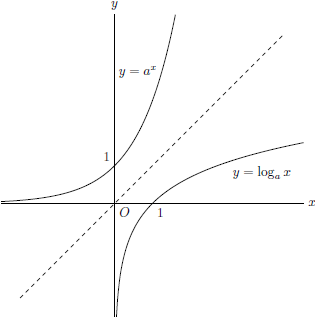
Exponential and Logarithmic Functions: These two are closely related. An exponential function, , models rapid growth or decay. A logarithmic function, , is its inverse. It answers the question: "what exponent do I need to raise '' to in order to get ''?" Their graphs are mirror images of each other across the line .
Transforming and Inverting Functions
Once you know the basic shape of a function's graph, you can move it around without re-plotting everything. These movements are called transformations.
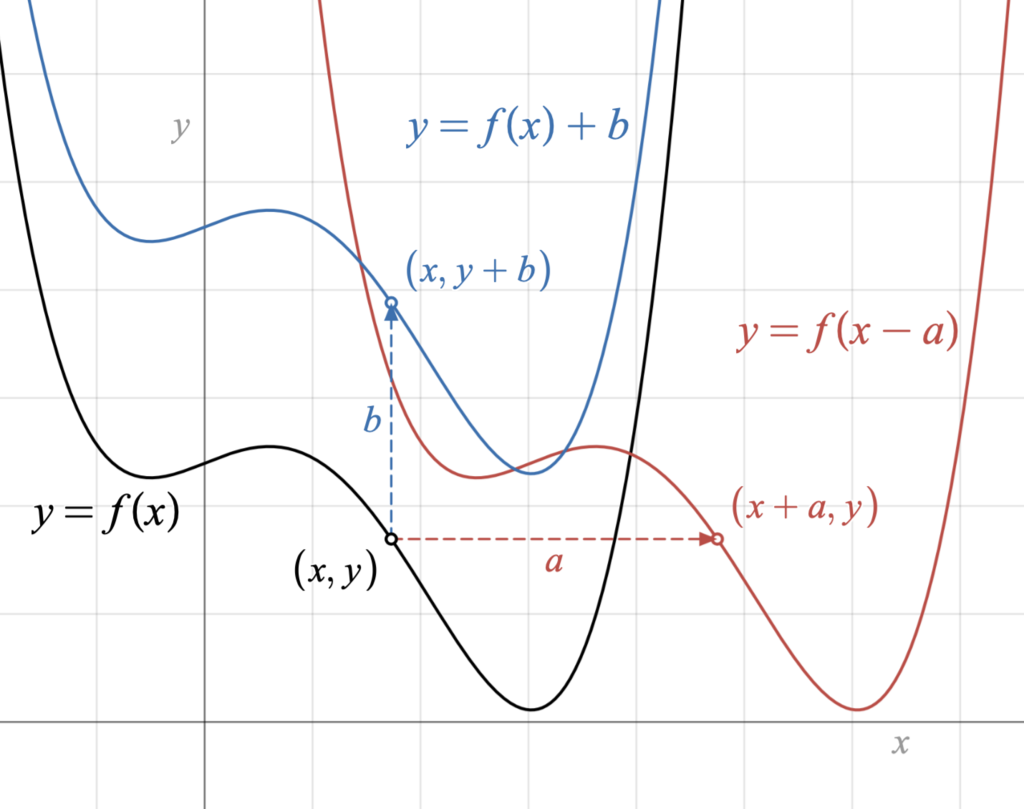
- Vertical Shift: Adding a constant to the outside of a function moves it up or down. shifts the graph up by units.
- Horizontal Shift: Adding a constant to the inside of a function moves it left or right. shifts the graph right by units, and shifts it left.
- Stretching/Compressing: Multiplying the function by a constant, , stretches it vertically if and compresses it if .
- Reflection: A negative sign also causes a reflection. reflects the graph across the x-axis, while reflects it across the y-axis.
Finally, we have inverse functions. If a function takes an input to an output , its inverse function, denoted , does the opposite: it takes back to . For a function to have an inverse, it must be "one-to-one," meaning every output corresponds to exactly one input. It must pass both the vertical and horizontal line tests.
To find the inverse, you can swap the and variables in the equation and solve for the new . For example, the inverse of is found by writing , swapping to get , and solving for to get . So, .
Understanding these core ideas about functions and their graphs is the first major step into the world of calculus. They are the objects we will analyze with more advanced tools later on.
A relation is considered a function if for every unique input, there is exactly one output.
What is the domain of the function ?