Calculus Fundamentals
Functions and Graphs
What is a Function?
Think of a function as a simple machine. You put something in, and you get something out. For example, a coffee grinder is a function: you put in coffee beans (the input), and you get ground coffee (the output). In math, functions work the same way but with numbers.
A function is a rule that assigns exactly one output to each input. If you put in the number 2, you'll always get the same specific number back. You'll never put in a 2 and get a 3 one time and a 5 the next. This reliability is key.
For every input, there is only one output.
We often write functions using a special notation, like . This is read as "f of x." The is the name of the function, and the inside the parentheses is the input, also known as the variable. So, if we have a function , it means our function 'f' takes any number 'x' and adds 3 to it. If we input 2, the output is .
Domain and Range
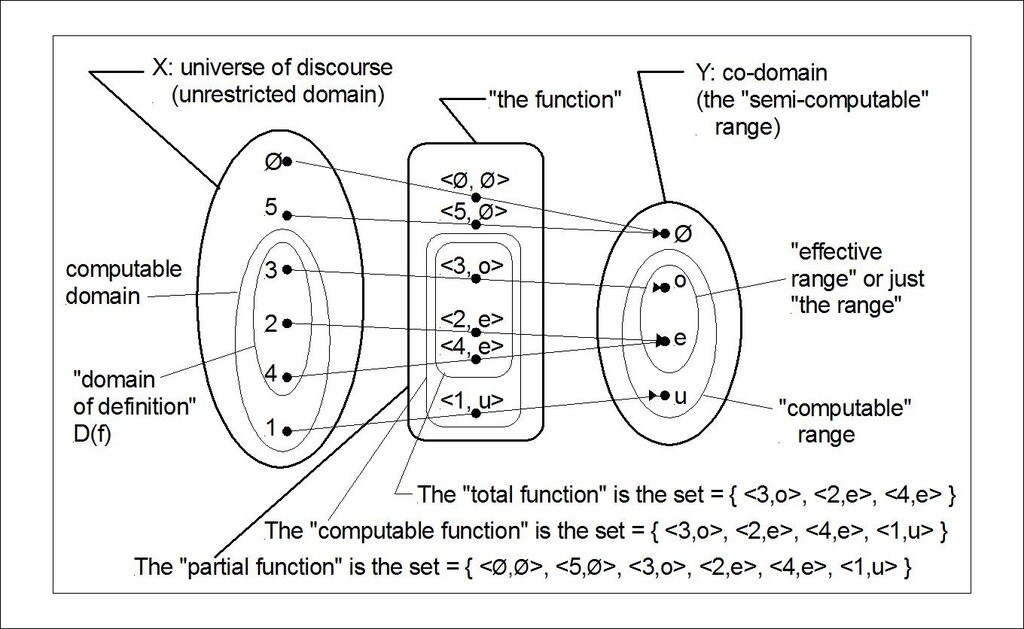
Two important ideas for any function are its domain and range. The domain is the set of all possible inputs the function can accept. The range is the set of all possible outputs the function can produce.
Domain
noun
The set of all possible input values for a function.
Range
noun
The set of all possible output values for a function.
For our coffee grinder, the domain is coffee beans. You can't put in rocks or juice. The range is ground coffee. You'll never get a block of ice out of it. For a mathematical function like , the domain is any number greater than or equal to zero, because you can't take the square root of a negative number in the real number system. The range is also all numbers greater than or equal to zero.
A Tour of Common Functions
Functions come in many flavors. Getting to know the basic types and their shapes is like learning the main characters in a story. It helps you understand the plot of more complex math problems.
| Function Type | General Form | Graph Shape |
|---|---|---|
| Linear | Straight Line | |
| Quadratic | Parabola (U-shape) | |
| Polynomial | Smooth, continuous curve | |
| Rational | Curve with breaks (asymptotes) | |
| Exponential | Rapid growth or decay curve | |
| Logarithmic | Slow growth curve |
Each of these function families has a distinct personality. Linear functions describe constant rates of change. Quadratic functions model things like the path of a thrown ball. Exponential functions are perfect for describing population growth or radioactive decay.
Bringing Functions to Life with Graphs
A graph is a picture of a function. It shows the relationship between the inputs (plotted on the horizontal x-axis) and the outputs (plotted on the vertical y-axis). Every point on the graph means that if you input into the function, you get out . Graphs help us see the behavior of a function at a glance.
A simple way to check if a graph represents a function is the Vertical Line Test. If you can draw a vertical line anywhere on the graph that crosses the curve more than once, it is not a function. This is because one input (the x-value where you drew the line) would have more than one output (the y-values where it crosses).
Shifting and Stretching Graphs
Once you know the basic shape of a function's graph, like the U-shape of a parabola, you can create many new functions by transforming it. These transformations are like giving the graph instructions to move, flip, or stretch.
Let's take a basic function, which we'll call . Common transformations include:
- Vertical Shifts: Adding a constant outside the function moves the graph up or down. shifts the graph up by units. shifts it down.
- Horizontal Shifts: Adding a constant inside the function moves the graph left or right. shifts the graph to the right by units. shifts it to the left.
- Reflections: A negative sign can flip the graph. reflects the graph across the x-axis. reflects it across the y-axis.
- Stretching and Compressing: Multiplying by a constant can stretch or shrink the graph. stretches it vertically if and compresses it if .
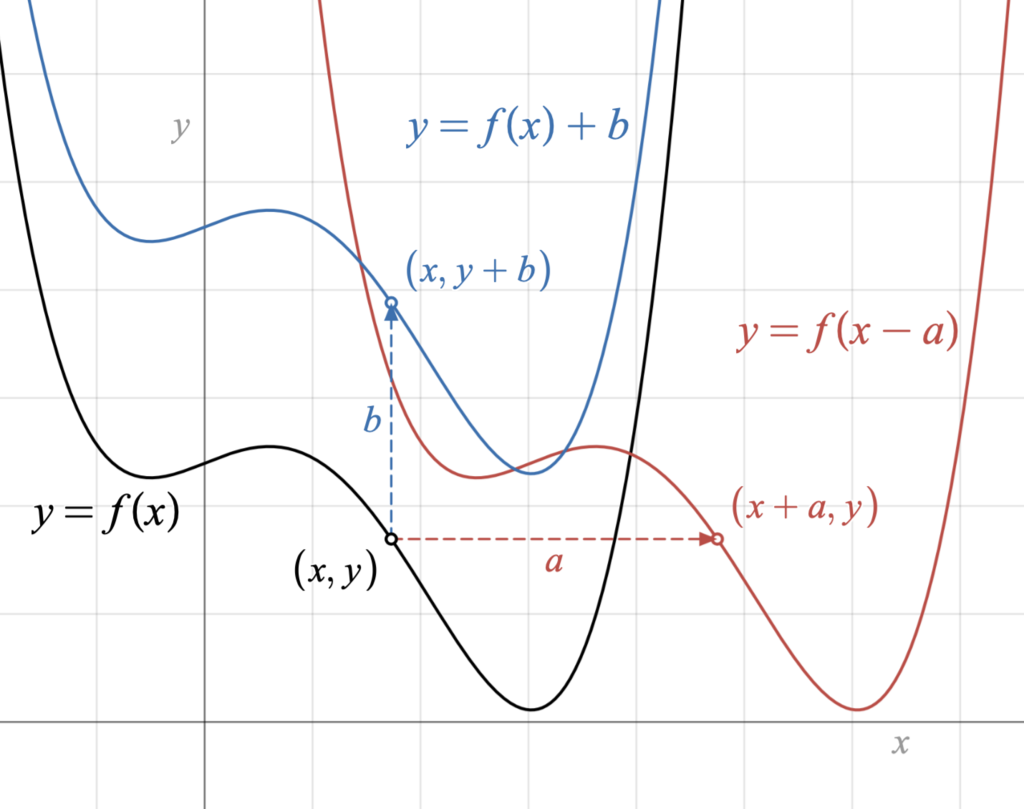
By combining these simple rules, you can graph very complex functions just by starting with a basic shape and applying a series of transformations. It's a powerful way to visualize functions without having to plot dozens of points.
Ready to check your understanding?
Which of the following statements best describes a function in mathematics?
If , what is the value of ?
Understanding functions and how their graphs behave is a cornerstone of higher math. With this foundation, you're ready to explore how these functions change.