Calculus Essentials Foundations
Functions and Graphs
What is a Function?
A function is like a machine. You put something in, and it gives you something back. For every input, there is exactly one output. Think of a coffee grinder: you put in coffee beans (the input), and you get coffee grounds (the output). You'd never put in beans and get out tea.
In math, the input is usually a number we call , and the output is another number we call or (read as "f of x"). The function itself is the rule that connects the input to the output. For example, the function is a rule that says "take whatever number you're given and add 2 to it."
The key rule of a function: every input must have one and only one output.
The set of all possible inputs for a function is called the domain. The set of all possible outputs is called the range. For our simple function , the domain could be all real numbers. Since we can get any real number as an output, the range is also all real numbers.
Common Functions and Their Graphs
Visualizing functions helps us understand their behavior. This is where graphs come in. A graph is just a picture of all the input-output pairs a function can produce. Let's look at some common types.
Linear Function
adjective
A function that creates a straight line when graphed. Its general form is .
In , the number represents the slope (how steep the line is), and is the y-intercept (where the line crosses the vertical y-axis).
Quadratic Functions These functions have the form , and their graphs are U-shaped curves called parabolas. If the 'a' term is positive, the parabola opens upwards. If it's negative, it opens downwards.
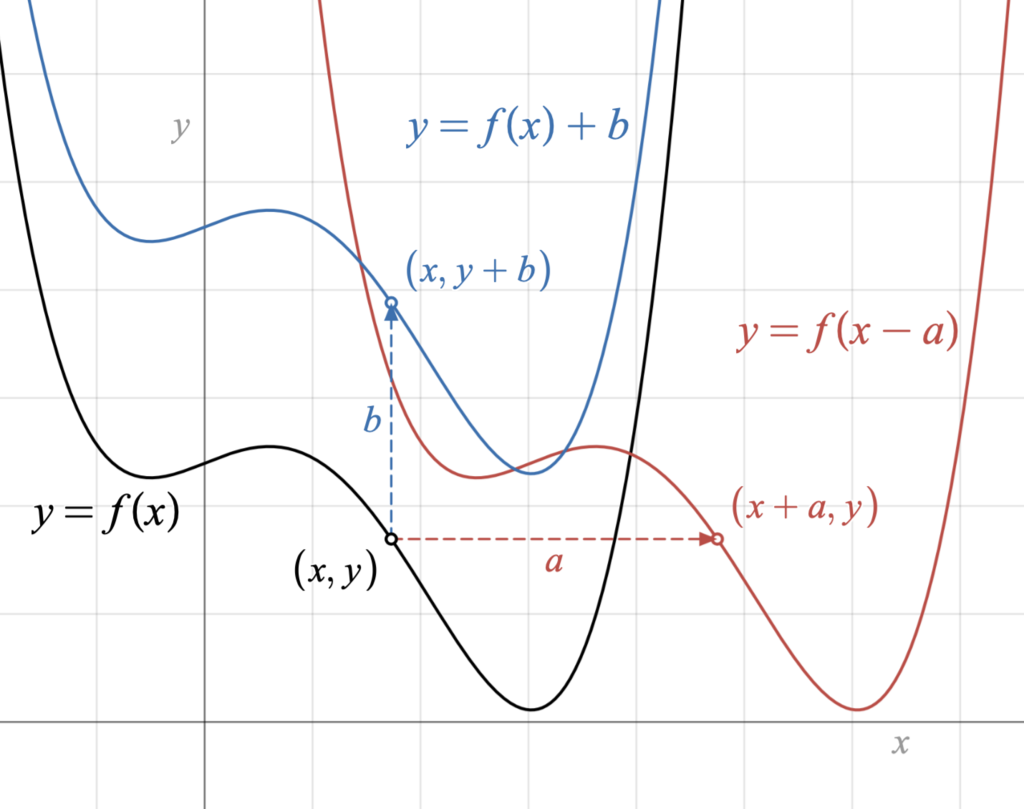
Polynomial Functions Polynomials are a broader category that includes linear and quadratic functions. They have the form . Their graphs are smooth, continuous curves that can have various turns and wiggles, depending on the highest power of (the degree).
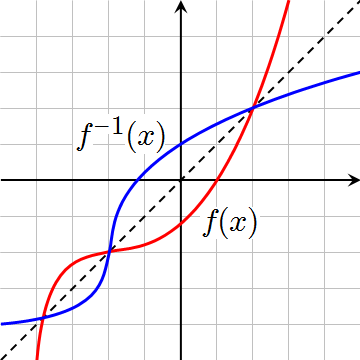
Exponential and Logarithmic Functions Exponential functions, like , model rapid growth or decay. They start slow and then shoot up (or down) very quickly. Logarithmic functions, like , are the inverses of exponential functions. They start with rapid growth that levels off.
Trigonometric Functions Functions like sine, cosine, and tangent are periodic, meaning they repeat their values in regular intervals. Their graphs are waves, which are useful for modeling things like sound, light, and ocean tides.
Reading a Graph
Once you have a graph, you can learn a lot about the function just by looking at it.
- Intercepts: The x-intercepts are where the graph crosses the horizontal x-axis (where ). The y-intercept is where it crosses the vertical y-axis (where ).
- Asymptotes: An asymptote is a line that a graph approaches but never touches. This often happens in functions where a denominator could be zero, or with logarithmic and some exponential functions.
- Intervals of Increase/Decrease: This is simply where the graph is going up or down as you read it from left to right. If the line is rising, the function is increasing. If it's falling, it's decreasing.
Understanding these basic functions and how to read their graphs is a core skill for calculus. It allows you to visualize the behavior of a function before you start analyzing it with more advanced tools.
Ready to check your understanding?
What is the defining characteristic of a mathematical function?
The set of all possible inputs for a function is called its...
Mastering these fundamentals prepares you for the next steps in calculus, where we'll explore what happens at specific points on these graphs.