Calculus Essentials
Functions and Graphs
What is a Function?
Think of a function as a rule, like a recipe. You give it an input (an ingredient), and it gives you exactly one output (a finished dish). In math, we usually work with numbers. You put a number in, the function performs an operation on it, and you get exactly one number out.
function
noun
A mathematical relationship where each input value is associated with exactly one output value.
This relationship is often written as , which you read as "f of x." The letter is the name of the function (the rule), and is the input. For example, if we have the function , it tells us to take any input and add 5 to it. If we plug in , we get . The input is 3, and the output is 8.
The key rule is that for any single input, there can only be one output. If you put 3 into the machine, it can't spit out both 8 and 10.
Domain and Range
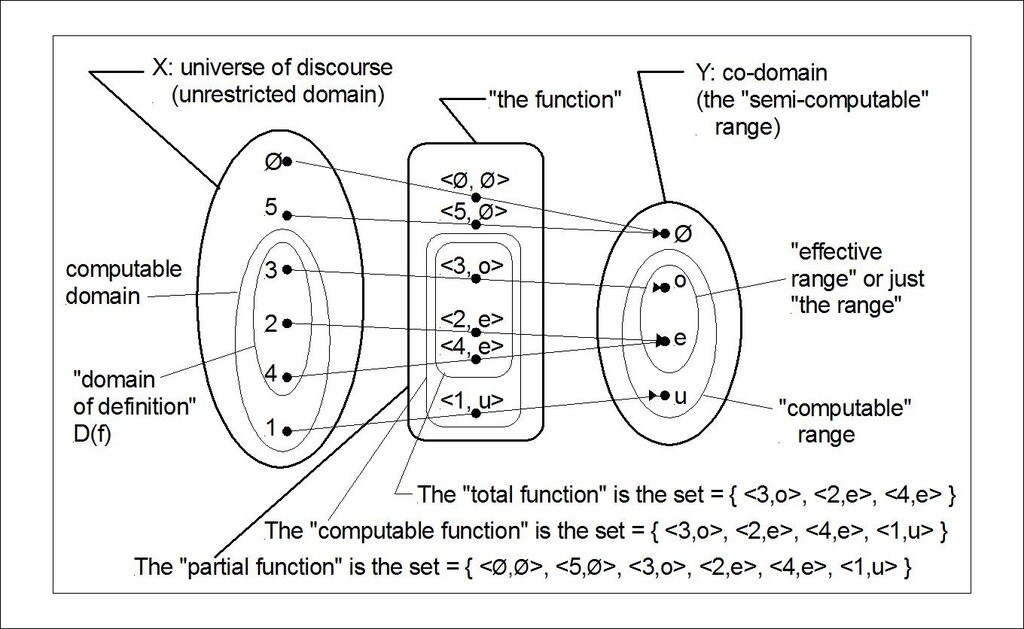
Every function has two important sets of values associated with it: the domain and the range.
domain
noun
The set of all possible input values (x-values) for a function.
range
noun
The set of all possible output values (y-values) that a function can produce.
Imagine a function that squares any number you give it, . You can put any real number into this function, so its domain is "all real numbers." However, the output will always be zero or positive. You can't square a number and get a negative result. So, its range is "all real numbers greater than or equal to 0."
Graphing Functions
A graph is a visual representation of a function. It plots every input-output pair as a point on a coordinate plane. The x-axis represents the domain (inputs), and the y-axis represents the range (outputs). By connecting these points, we can see the shape of the function and understand its behavior.
A simple test to see if a graph represents a function is the Vertical Line Test. If you can draw a vertical line anywhere on the graph and it crosses the curve more than once, it is not a function. This is because it would mean one x-value has multiple y-values.
Let's look at a few common types of functions.
Linear Functions: These create straight lines on a graph. Their rule is . Here, represents the slope (how steep the line is) and is the y-intercept (where the line crosses the y-axis).
Polynomial Functions: These are built from variables raised to positive integer powers, like (a parabola) or (a cubic function).
Exponential and Logarithmic Functions: Exponential functions, like , show rapid growth or decay. Logarithmic functions, like , are their inverses and grow very slowly.
Function Transformations
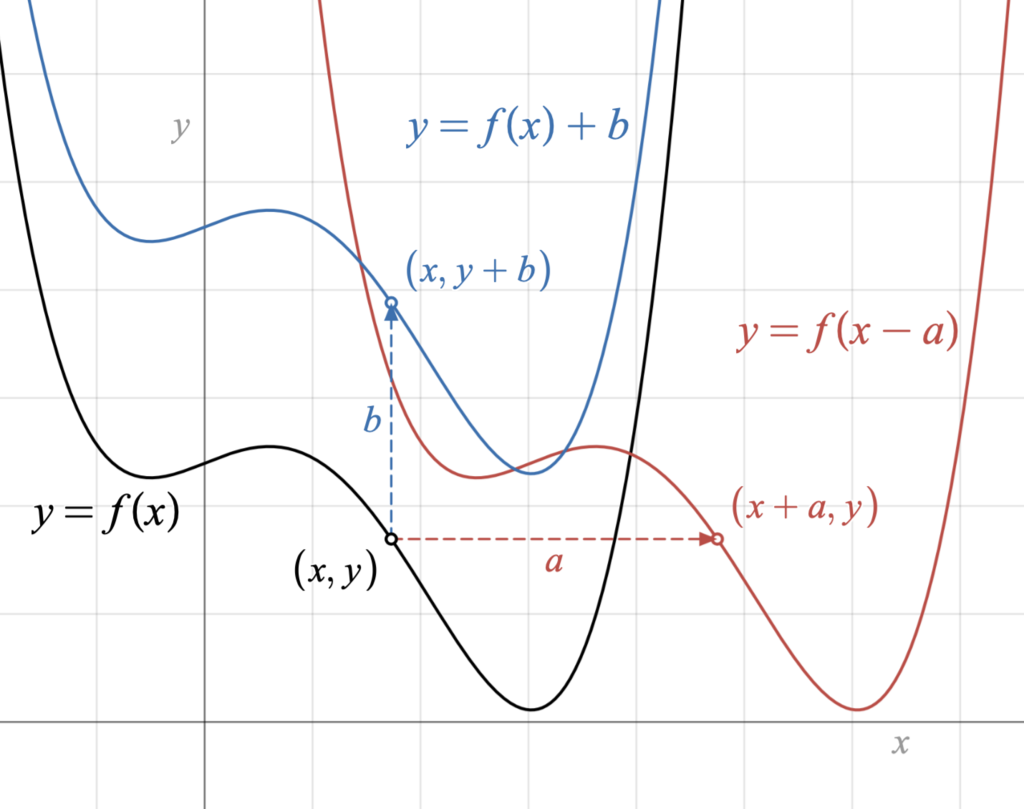
Once you know the shape of a basic function, like , you can create many variations by transforming it. These transformations shift, stretch, or reflect the graph.
- Vertical Shifts: Adding a constant outside the function moves the graph up or down. shifts the graph up by units. shifts it down.
- Horizontal Shifts: Adding a constant inside the function moves the graph left or right. shifts the graph to the right by units. shifts it to the left.
- Reflections: A negative sign can reflect the graph. reflects it across the x-axis (flipping it upside down). reflects it across the y-axis (flipping it left to right).
Inverse Functions
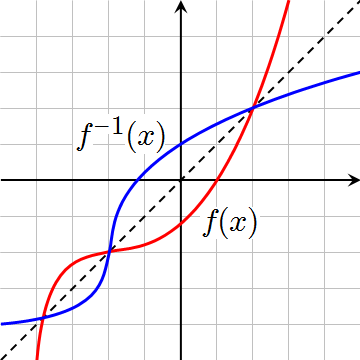
Some functions have an inverse, which essentially undoes the original function's operation. If a function turns an input into an output , its inverse, written as , will turn back into . In other words, if , then .
For a function to have an inverse, it must be "one-to-one." This means that every output corresponds to exactly one input. It must pass the Horizontal Line Test—a horizontal line can never cross the graph more than once.
A classic example is the relationship between exponential and logarithmic functions. The function takes an input and uses it as a power. Its inverse, , finds what power you need to raise 2 to in order to get .
Graphically, the inverse of a function is its reflection across the diagonal line .
Let's check your understanding of these core concepts.
What is the fundamental rule for a relationship to be considered a function?
If you have the function , what is its range?
Understanding functions and how they are represented visually is a critical first step for tackling calculus.