Calculus Essentials
Functions and Graphs
What is a Function?
Think of a function as a simple machine, like a toaster. You put in an input (a slice of bread), the machine follows a specific rule (toast it), and you get a single, predictable output (a slice of toast). You'll never put in bread and get back a waffle.
In math, a function is a rule that assigns exactly one output to each input. We usually call the input and the output , or (read as "f of x"). The function is a rule that says, "take any number and add 2 to get the output."
If you input , the function gives you the output . One input, one output.
The key idea is consistency. For any given input, there can only be one output. If you put 3 into our machine and sometimes got 5 and other times got 8, it wouldn't be a function.
Domain and Range
Functions don't necessarily work with every possible number. The set of all allowed inputs for a function is called its domain. Think of it as the list of ingredients your machine is designed to handle. A toaster's domain is bread; it's not designed for shoes or soup.
The set of all possible outputs a function can produce is called its range. A toaster's range is toast. It can't produce orange juice, no matter what you put in. The domain determines the range.
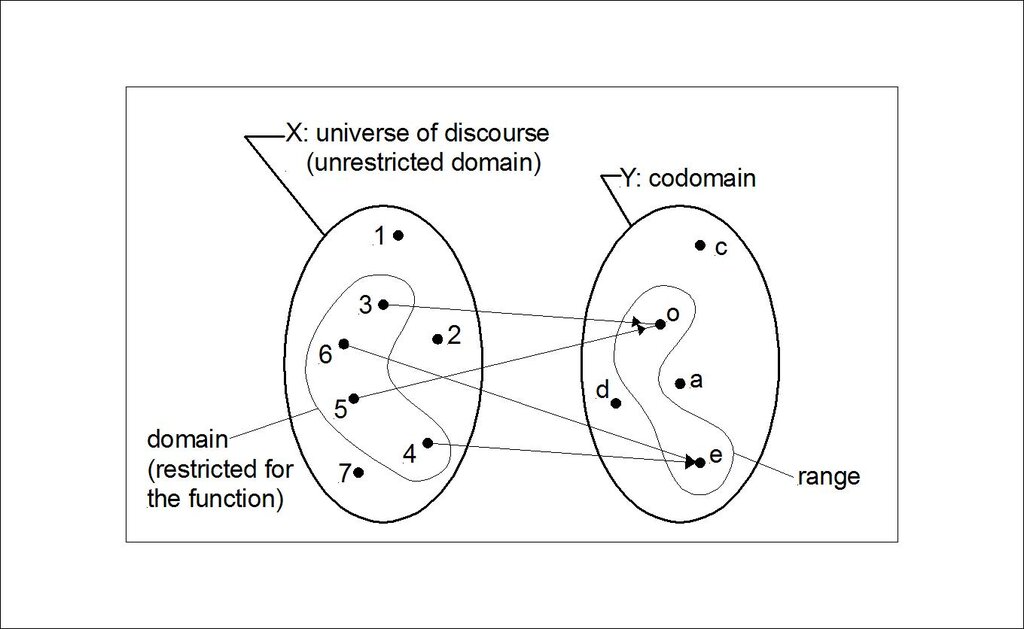
Consider the function . You can square any real number, so its domain is all real numbers. But what about the range? Since squaring any number (positive or negative) results in a positive number or zero, the range is all non-negative numbers (). You can't get an output of -4 from this function.
Visualizing Functions with Graphs
The best way to understand a function's behavior is to see it. We can plot a function on a graph by treating its inputs and outputs as coordinates . Each point on the graph represents one input-output pair. When we connect all the points, we see the function's shape.
Let's look at a few common types.
Linear Functions: These have the form and their graphs are always straight lines. The number controls the steepness (slope), and tells you where the line crosses the vertical y-axis.
Quadratic Functions: These look like . Their graphs are U-shaped curves called parabolas. The parabola opens up if is positive and down if is negative.
Polynomial Functions: These are more general, like . They create smooth, flowing curves with various peaks and valleys.
How can you tell if a graph represents a function? Use the Vertical Line Test. If you can draw a vertical line anywhere on the graph and it only ever crosses the curve at one point, it's a function. If it crosses more than once, it's not a function because that one input (-value) would have multiple outputs (-values).
Reading the Story of a Graph
A graph tells a story. By looking at its shape, you can quickly understand a function's behavior without doing any calculations.
Where the graph is rising from left to right, the function is increasing. This means as the input gets bigger, the output also gets bigger. Where the graph is falling, the function is decreasing.
Peaks and valleys on the graph are also important. A peak is a local maximum, a point where the function's value is higher than at nearby points. A valley is a local minimum, where the value is lower than its neighbors.
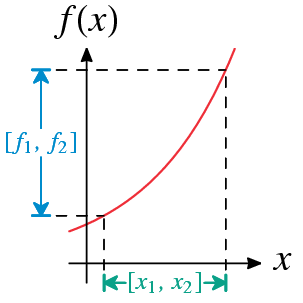
These concepts, especially the idea of how a function changes, are the building blocks for calculus. Understanding how to read and interpret graphs is a crucial first step.
Ready to check your understanding?
What is the defining characteristic of a function in mathematics?
A function is described by the rule "double the input and then subtract 3." What is the correct notation for this function, and what is the output for an input of 5?
Great work. A solid grasp of functions and graphs is the foundation for everything that comes next in calculus.