Calculus 1 Fundamentals
Functions and Graphs
What is a Function?
Think of a function as a simple rule. For every input you give it, it gives you exactly one output. It's like a consistent machine: put in a number, and it spits out another number based on its internal rule. We often write functions as , which you can read as "f of x." The letter is the name of the function (the rule), and is the input.
Function
noun
A mathematical rule that assigns to each input value exactly one output value.
Two important ideas that come with functions are the domain and the range.
Domain
noun
The set of all possible input values (x-values) for a function.
Range
noun
The set of all possible output values (y-values) that a function can produce.
The domain is everything you're allowed to put into the function, and the range is everything you might get out. For example, in the function , you can put in any number you want (the domain is all real numbers), but the output will always be zero or positive (the range is ).
A Tour of Common Functions
While there are countless functions, a few families show up over and over again. Getting to know their basic shapes is key.
Linear Functions are the simplest. Their graphs are straight lines. The general form is , where is the slope (how steep the line is) and is the y-intercept (where the line crosses the vertical axis).
Quadratic Functions create a U-shaped curve called a parabola. Their formula is . If is positive, the U opens upwards; if it's negative, it opens downwards.
Polynomial Functions are a broader category that includes linear and quadratic functions. They look like . Their graphs are smooth, continuous curves that can have several peaks and valleys.
Exponential Functions, like , start slow and then grow incredibly fast, or they can do the opposite and decay quickly toward zero. They're useful for modeling things like population growth or radioactive decay.
Logarithmic Functions, like , are the inverses of exponential functions. They start with rapid growth that then levels off. They help answer the question, "What exponent do I need to get this number?"
Trigonometric Functions, like and , produce repeating waves. These are essential for describing anything that oscillates or follows a cycle, from sound waves to the orbits of planets.
Transforming Graphs
Once you know the basic shape of a function, you can move it around without having to plot a bunch of new points. This is called transformation. We can shift, stretch, compress, and reflect graphs.
A vertical shift moves the graph up or down. To graph , you take the graph of and move it up by units. For , you move it down.
A horizontal shift moves the graph left or right. This one can feel backward at first. To graph , you move the graph of to the right by units. For , you move it to the left.
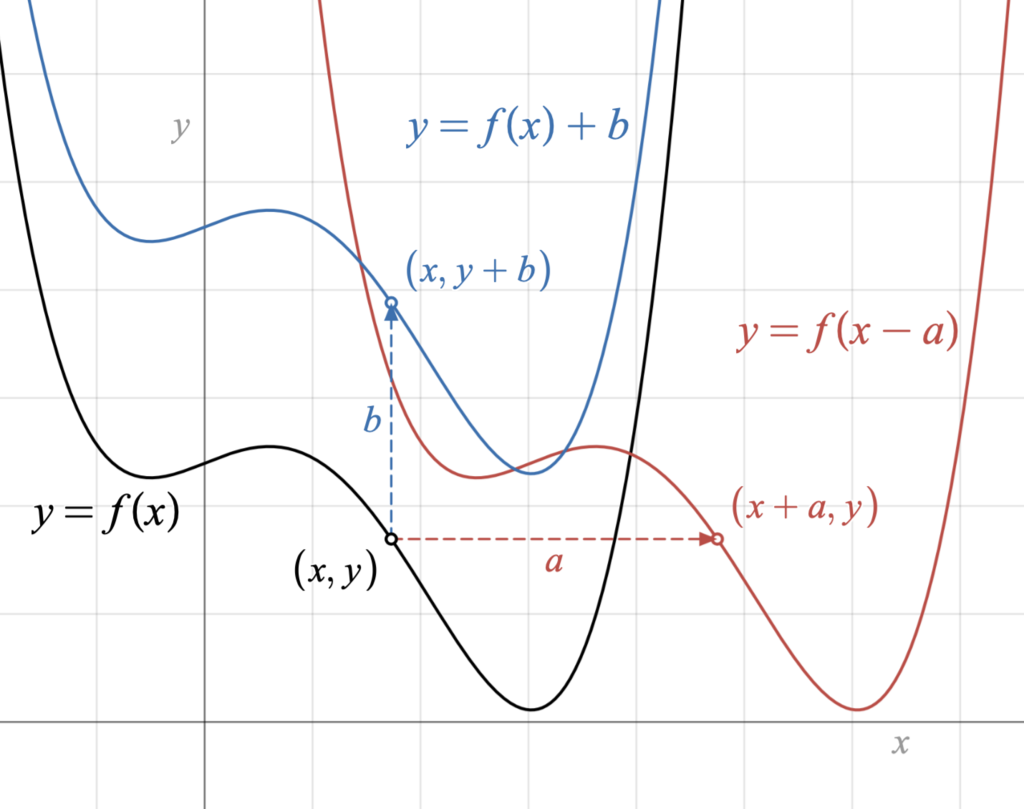
We can also stretch or compress graphs. Multiplying the whole function by a number, like , causes a vertical stretch (if ) or compression (if ). Multiplying the input by a number, , causes a horizontal compression or stretch.
Finally, putting a negative sign in front, , reflects the graph across the x-axis. A negative sign inside, , reflects it across the y-axis.
Inverse Functions
Some functions have an inverse, which essentially undoes what the original function did. If a function turns an input into an output , then its inverse function, written as , will turn back into .
For example, if , it takes an input and doubles it. Its inverse, , takes an input and halves it, undoing the original operation.
Not every function has an inverse. For a function to have an inverse, it must be "one-to-one," meaning that every output corresponds to exactly one input. Graphically, this means the function must pass the "horizontal line test": if you can draw a horizontal line that crosses the graph more than once, the function does not have an inverse.
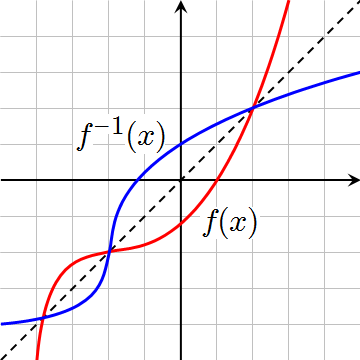
The graph of an inverse function is a mirror image of the original function's graph across the diagonal line . This visual relationship makes it easy to see how the inputs and outputs are swapped.
Which of the following statements best defines a function?
Consider the function . What is its range?
Understanding these core ideas about functions and their graphs is the first major step into the world of calculus. They provide the visual and conceptual language for everything that comes next.