Business Cost Analysis and Estimation
Costing Fundamentals Revisited
The Real Behavior of Costs
You already know that costs can be filed into two neat buckets: fixed and variable. Rent is fixed. Raw materials are variable. But in the real world, many costs don't fit cleanly into either category. They're a mix of both.
Think about your company's utility bill. There's likely a base service charge you have to pay just to stay connected (a fixed cost), plus an additional charge for every kilowatt-hour of electricity you use (a variable cost). This is a mixed cost. To make smart decisions, you need to break these costs down into their fixed and variable parts.
A straightforward way to do this is the high-low method . It's not perfect, but it gives a quick and useful estimate. You just need two data points: the total cost and activity level from the highest and lowest periods of activity.
First, you calculate the variable cost per unit of activity.
Once you have the variable cost per unit, you can solve for the fixed cost. Just plug the variable cost back into the total cost formula for either the high or low point.
Example: A factory's highest activity month had 10,000 machine hours and a utility bill of 💲15,000. Its lowest month had 6,000 hours and a bill of 💲11,000. The variable cost is (💲15,000 - 💲11,000) / (10,000 - 6,000) = 💲1 per machine hour. The fixed cost is 💲15,000 - (💲1 x 10,000) = 💲5,000 per month.
Costs That Jump
Some costs appear fixed but then suddenly jump to a new level when activity passes a certain point. These are called step-variable costs. They are fixed only within a certain range of activity, known as the relevant range.
Imagine a manufacturing plant with one supervisor who can oversee up to 15 workers. The supervisor's salary is a fixed cost. But if the company needs a 16th worker to meet demand, it must hire a second supervisor. The total cost of supervision has now jumped to a new, higher fixed level. It will stay at that level until a 31st worker is needed, requiring a third supervisor.
Understanding the relevant range is critical for planning. If you project a 5% increase in production, you need to know if that small change will push you over a threshold and trigger a significant jump in fixed costs. Ignoring step-costs can lead to disastrously inaccurate budgets.
Break-Even in a Multi-Product World
Calculating the break-even point for a company that sells one product is simple. But what about a business that sells multiple products, each with a different price and variable cost? To find the break-even point for the whole company, you need to use a weighted-average contribution margin.
First, you determine the sales mix—the proportion of total sales that each product represents. For example, a coffee shop might find that 60% of its sales are coffee, 30% are pastries, and 10% are merchandise. You then calculate the contribution margin for each product line. Finally, you combine these to find the weighted-average contribution margin per unit.
We will use the above assumptions to construct a weighted average contribution margin (WACM) that’s used in place of the single-product contribution margin in earlier CVP and break-even calculations.
This tells you the total number of units you need to sell. To find out how many of each product you need to sell, you just apply the sales mix percentages to the total break-even units. This analysis is vital for setting sales targets and understanding how shifts in customer preferences can affect overall profitability.
The Costs That Truly Matter
Not all costs are created equal, especially when making decisions. Accounting costs are the explicit, out-of-pocket expenses that appear on your financial statements. But for strategic planning, you must also consider economic costs, which include something that never shows up in a ledger: opportunity cost .
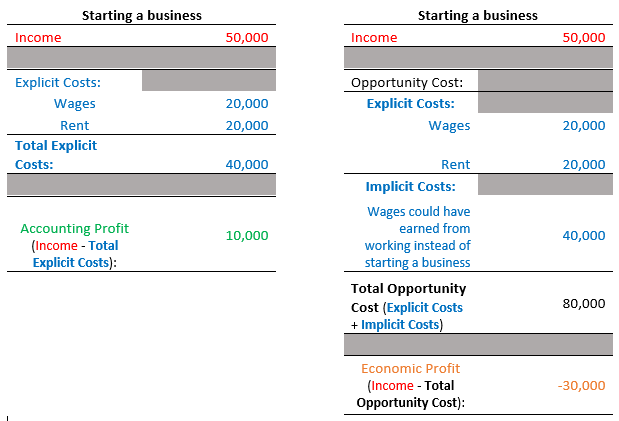
Opportunity cost is the value of the next-best alternative you give up when you make a choice. Suppose your factory has the capacity to produce 1,000 widgets per month, which you sell for a contribution margin of $10 each. A new customer offers to buy 200 units of a custom product, which would yield a contribution margin of $15 each. However, producing the custom order would require you to forgo producing 200 of your standard widgets.
The opportunity cost of taking the special order is the lost contribution margin from the standard widgets: 200 units × $10/unit = $2,000. Your net gain would be (200 x $15) - $2,000 = $1,000. While the special order looks more profitable per unit, considering the opportunity cost gives a full picture.
Just as important is knowing which costs to ignore. Sunk costs are expenses that have already been incurred and cannot be recovered. A classic example is money spent on market research for a product that ultimately fails. That money is gone, regardless of what you do next. Dwelling on sunk costs can lead to bad decisions, like throwing more money at a failing project to 'justify' the initial investment—a fallacy known as the 'sunk cost trap'.
Effective managers learn to focus only on future costs and benefits that differ between alternatives. They master the art of seeing both the visible accounting costs and the invisible opportunity costs, while completely ignoring the unchangeable sunk costs.
A company reports the following data for its factory overhead: at its highest activity level of 10,000 machine hours, total costs were $25,000. At its lowest activity level of 6,000 machine hours, total costs were $17,000. Using the high-low method, what is the estimated variable cost per machine hour?
A manufacturing company's supervisory salaries cost is $60,000 per month for up to 20 production workers. If a 21st worker is hired, an additional supervisor must be hired, increasing the total salary cost to $120,000. This type of cost is best described as a: