Brooks Trading Principles
Introduction to Price Action
Reading the Market's Story
Price action is the raw movement of a security's price over time. When you look at a financial chart, you're looking at price action. It's the collective story of every buy and sell decision made by traders around the world.
Instead of relying on indicators that lag behind the price, price action trading is about reading this story directly from the chart. It's a skill that helps you understand the psychology of the market—the balance of power between buyers (bulls) and sellers (bears).
The core idea is simple: all important market information is reflected in the price itself.
Candlesticks: The Building Blocks
The most common way to view price action is with a candlestick chart. Each candle tells you what happened to the price over a specific time period, whether it's one minute, one day, or one week.
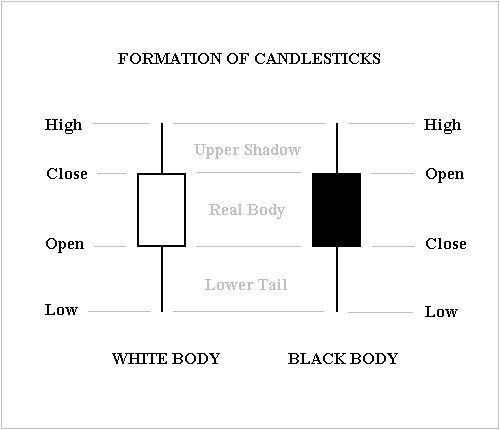
A candlestick has two main parts:
- The Body: This is the thick part of the candle. It shows the range between the opening and closing price. If the close is higher than the open, it's typically green (or white), showing a price increase. If the close is lower than the open, it's red (or black), showing a price decrease.
- The Wicks (or Shadows): These are the thin lines extending above and below the body. They show the highest and lowest prices reached during that period.
The size and shape of the body and wicks reveal the
Long wicks on top of a candle suggest that sellers overwhelmed buyers, pushing the price back down. Long wicks on the bottom suggest buyers stepped in and pushed the price up.
Support and Resistance
As prices move, they often seem to hit invisible barriers. These are called support and resistance levels. Think of them like a floor and a ceiling for the price.
- Support: This is a price level where a downtrend is likely to pause or reverse. It's a
These levels are rarely exact lines; they are more like zones. A support level is broken when the price closes decisively below it, and it can then become a new resistance level. The opposite is true for resistance.
Putting It All in Context
A single candlestick or a support level doesn't tell you the whole story. To make sense of price action, you need to understand the market context. The most basic context is the trend.
An uptrend is a series of higher highs and higher lows. It shows that buyers are in control.
A downtrend is a series of lower highs and lower lows, indicating that sellers are dominant.
A trading range occurs when the market moves sideways, bouncing between clear support and resistance levels. Neither buyers nor sellers have the upper hand.
By identifying the overall trend, you can better interpret individual price signals. A bullish candle pattern is more significant in an uptrend than in a downtrend. Context is what transforms random price movements into actionable information.
What does 'price action' primarily represent in financial markets?
On a candlestick chart, what does the 'body' of the candle show?
Understanding these core elements—candlesticks, support, resistance, and market context—is the first step in learning to read the market's language.