Bio-DeepTech Engineering and Techno-Economics for Product Leaders
Bioprocess Reaction Kinetics
Stoichiometry and Yield
In bioprocess engineering, the conversion of substrate to biomass and product is governed by fundamental stoichiometric relationships. These aren't just academic exercises; they are the core calculations that determine process feasibility and economic viability. The first step is defining the overall reaction.
From this, we derive the yield coefficients, which are critical KPIs for any bioprocess. They quantify the efficiency of the conversion. The two most important are the biomass yield on substrate () and the product yield on substrate ().
tells you how many grams of cells you get for every gram of substrate consumed. tells you how many grams of product are formed per gram of substrate. These are not theoretical maximums; they are experimentally determined values that reflect the reality of the specific strain and process conditions. They are the first reality check on your process's potential titer.
These yields are constrained by mass and energy balances. A cell must allocate substrate not just for growth and product formation, but also for cellular maintenance—the energy required to stay alive. This is where the Pirt model comes in, refining the simpler growth models by accounting for non-growth-associated energy demands.
Modeling Cell Growth
To predict how a culture will grow over time, we need kinetic models. The Monod equation is the cornerstone, describing the relationship between the specific growth rate () and the concentration of a single limiting substrate (). It's analogous to Michaelis-Menten kinetics for enzymes, but applied to the entire organism.
While Monod is foundational, it assumes that all consumed substrate contributes to new biomass. The Pirt model provides a more realistic view by introducing a maintenance energy coefficient (). It acknowledges that cells burn substrate just to maintain viability, even when not actively dividing. This is critical for modeling fed-batch or continuous cultures where growth rates might be low but cells are active for long periods.
The distinction between the observed yield () and the true yield () is crucial. The observed yield changes with the growth rate, while the true yield is a constant physiological parameter. At high growth rates, maintenance energy is a smaller fraction of total energy consumption, so approaches . At low growth rates, maintenance dominates and the observed yield drops significantly.
Metabolic Flux and Inhibition
Yield and growth models give us a high-level view. Metabolic Flux Analysis (MFA) takes us inside the cell. MFA uses the stoichiometry of the cell's metabolic network to quantify the flow of metabolites—the flux—through different pathways. By measuring substrate uptake and product secretion rates (which are inputs to the model), we can estimate the internal fluxes. This allows us to identify bottlenecks, pinpoint inefficient pathways, and rationally design strains for higher productivity.
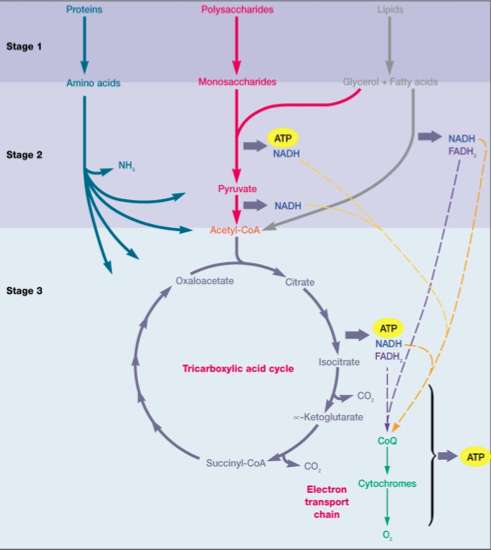
Of course, metabolic pathways don't operate in a vacuum. Their rates are affected by inhibitors, which can be the substrate itself, the product, or other compounds in the fermentation broth. Understanding inhibition kinetics is vital for process optimization, especially in high-density cultures where concentrations of these compounds can become very high.
The three primary types of inhibition are:
- Competitive Inhibition: The inhibitor competes with the substrate for the enzyme's active site. Increasing substrate concentration can overcome this. This changes the apparent but not .
- Uncompetitive Inhibition: The inhibitor binds only to the substrate-enzyme complex, not the free enzyme. Increasing substrate concentration actually worsens this type of inhibition. It lowers both the apparent and .
- Mixed Inhibition: The inhibitor can bind to both the free enzyme and the enzyme-substrate complex. This is the most common type and affects both and .
Modeling these effects is critical for designing feeding strategies. For example, if your product is inhibitory (a common scenario), you need to design a process that keeps the product concentration below the critical inhibitory threshold, perhaps through continuous removal.
Let's test your understanding of these core concepts.
In a bioprocess, what does the yield coefficient represent?
The Pirt model for microbial growth is a refinement of the Monod model because it specifically accounts for:
Mastering these quantitative principles is the foundation of effective bioprocess development. They allow you to translate cellular biology into predictive engineering models, forming the basis for scale-up, optimization, and ultimately, a viable product.