BigCommerce Analytics Mastery
BigCommerce Analytics Overview
Your BigCommerce Dashboard
Before you connect any external tools, it's worth getting to know the powerful analytics suite BigCommerce builds right into its platform. This is your command center for understanding your store's performance.
To find it, navigate to the Analytics section in your BigCommerce admin panel. The first page you'll likely see is the Store Overview. This dashboard gives you a high-level snapshot of your business's health, summarizing key metrics in one place.
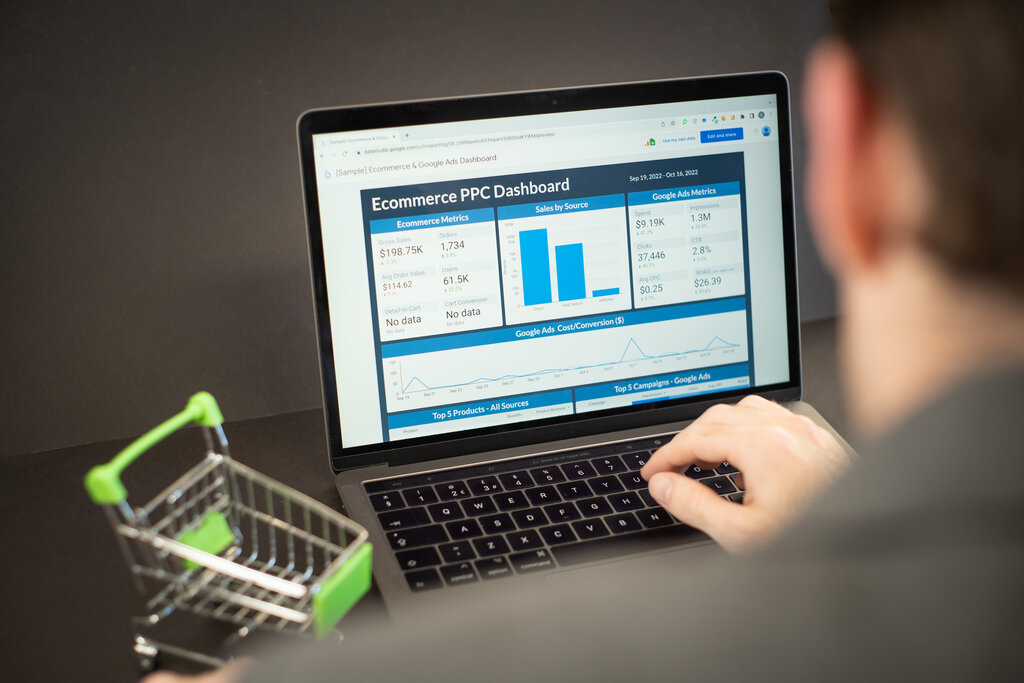
Think of the overview as your morning coffee check-in. You can quickly see total revenue, the number of orders, your conversion rate, and the average value of each order. It’s designed to give you the most important information at a glance, helping you spot trends or potential issues without digging too deep.
Interpreting Sales Reports
The sales reports are the financial pulse of your store. They tell you not just how much money you're making, but how you're making it. In the Sales section of your analytics, you'll find several important reports. The most common metrics you'll encounter are:
- Revenue: The total amount of money generated from sales.
- Orders: The total number of transactions.
- Items Sold: The total count of individual products sold.
- Average Order Value (AOV): The average amount customers spend per transaction. This is calculated by dividing total revenue by the number of orders.
- Conversion Rate: The percentage of visitors who make a purchase. This is a crucial indicator of how effectively your store turns browsers into buyers.
Monitoring your conversion rate is key. A low rate might indicate issues with your product pages, pricing, or checkout process.
The real power comes from analyzing these metrics over time. The reports allow you to select different date ranges. Compare this month's performance to last month's, or look at the same quarter last year. Is your revenue growing? Is your average order value increasing? These comparisons turn raw data into a story about your business's trajectory.
Analyzing Customer Data
Behind every sale is a customer. The Customers reports help you understand who is buying your products. This is where you can shift your focus from transactions to relationships.
One of the most valuable reports here is the New vs. Returning Customers analysis. A healthy store has a good mix of both. New customers mean your marketing is reaching people, while a high number of returning customers signals strong brand loyalty and product satisfaction. If you notice your returning customer rate is low, it might be time to think about a loyalty program or email marketing to re-engage past buyers.
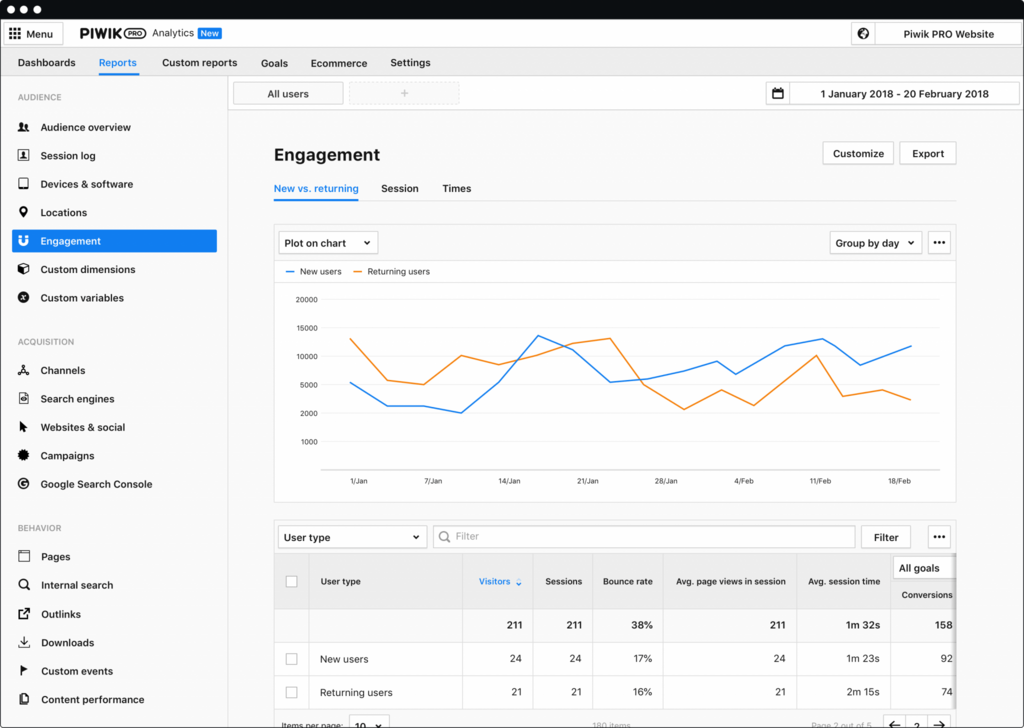
You can also identify your most valuable customers. The reports will show you who has spent the most money in your store over time. These are your VIPs. Knowing who they are can help you tailor special offers or thank them for their business, further strengthening that relationship. Other reports might show you where your customers are located, which can be useful for making decisions about shipping and targeted advertising.
Evaluating Product Performance
Finally, the Products reports tell you what's selling and what's not. These insights are essential for managing your inventory, planning promotions, and deciding which products to feature.
The most straightforward metric is Units Sold, which tells you your bestsellers. But don't stop there. Look at Product Revenue to see which items are generating the most income. Sometimes a lower-volume item with a high price point can be more profitable than a popular, cheaper item.
| Metric | What It Tells You |
|---|---|
| Most Viewed Products | Which products are getting the most attention from visitors. |
| Best Selling Products | Which products are actually being purchased the most. |
| Product Conversion Rate | The percentage of viewers for a specific product that end up buying it. |
| Inventory Levels | How much stock you have left for each product. |
Comparing your most viewed products to your best selling products can reveal interesting patterns. If a product gets a lot of views but has a low conversion rate, there might be an issue with its price, description, or images. This data gives you a clear starting point for optimization.
What is the primary purpose of the Store Overview dashboard in BigCommerce analytics?
Which of the following metrics is a crucial indicator of how effectively your store turns visitors into buyers?
By mastering these built-in tools, you can make smarter, data-driven decisions to grow your store without needing to immediately invest in external software.