Applied Urban Morphological Analysis
Town Plan Analysis
Deconstructing the Town Plan
To understand a city's evolution, we must first learn to disassemble its physical form. A town plan isn't a single, static entity. It's a composite of three distinct but interconnected elements: the street system, the plot system, and the building patterns. Think of these as three separate layers of information superimposed on one another. The street system forms the skeleton, a resilient framework that often outlasts everything else. The plot system, or the pattern of land division, is the flesh on those bones. Finally, the building fabric represents the skin, the most frequently changing element as structures are altered, demolished, and replaced.
This tripartite division, a cornerstone of Conzenian analysis, is our primary analytical lens. By isolating each layer, we can see how they influence one another. A medieval street layout, for example, dictates the size and shape of the plots fronting it. In turn, these plot dimensions constrain the types of buildings that can be constructed. This process of deconstruction is the first step in reading a city's structural history.
Cities are mosaics. They are not uniform wholes but collections of distinct areas, each formed during a specific period under specific influences. We call these areas 'plan units' or, more technically, 'morphogenetic units'. A Georgian terrace, a post-war housing estate, and a medieval town core are all distinct morphogenetic units. Each one has a coherent internal structure of streets, plots, and buildings that reflects the time it was laid out. Identifying the boundaries of these units is a key task in town plan analysis. It allows us to chart the city's growth not as a single amorphous blob, but as a series of discrete, layered additions.
Boundaries and Belts
The growth of a town isn't random; it is guided and constrained by existing features. Certain boundaries become embedded in the urban fabric, resisting change for centuries. These are called 'fixation lines'. The most obvious example is a former city wall. Long after the wall is demolished, its line often persists as a major road, a property boundary, or a distinct change in the street pattern. Rivers, old agricultural field boundaries, and railway lines can all act as fixation lines, creating permanent seams in the town plan.
As a town expands, it also develops what is known as a 'fringe belt'. This is a zone on the edge of the built-up area characterised by land uses that require large plots of land and are often incompatible with dense urban living: hospitals, university campuses, parks, cemeteries, and railway yards. As the city grows further, it engulfs this belt, which then becomes a permanent feature embedded within the urban structure. The fringe belt acts as a significant barrier to radial expansion, forcing new growth to leapfrog it or develop alongside it.
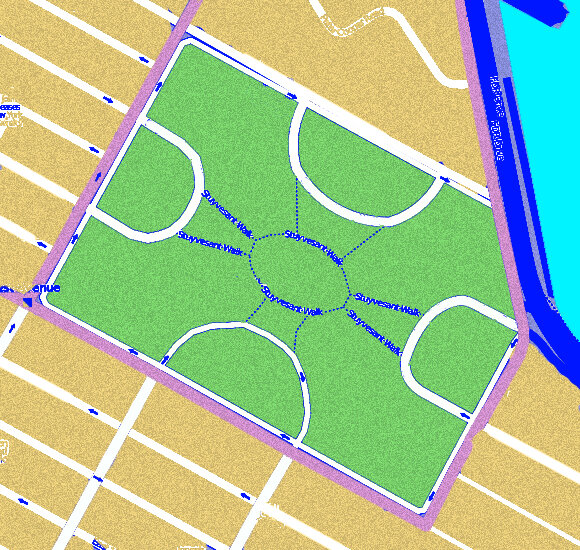
These concepts are not just academic. For instance, a fixation line left by an old industrial canal might explain why one neighbourhood has poor connectivity with another, even in a modern city. The presence of an old fringe belt, now a ring of parks and institutional buildings, can create a desirable 'green belt' but also a barrier for transport infrastructure.
The Analytical Workflow
The practical application of this analysis hinges on diachronic mapping, which means comparing maps from different historical periods. The workflow is systematic.
First, you gather your source material. This typically includes the earliest reliable map of the town, a mid-19th century map (like the first Ordnance Survey editions in the UK), and a contemporary map. These provide snapshots of the town plan at key stages of its development.
Next, you begin the process of 'peeling back the layers'. Starting with the oldest map, you identify the primary plan elements of the historic core. You then overlay the next map in the sequence, tracing the additions and modifications. You are looking for the seams between different morphogenetic units. Where does the tight medieval street pattern give way to the more regular grid of an 18th-century expansion? The boundary between them is a critical piece of the city's story.
As you map these changes, you identify the forces shaping them. Mark out the fixation lines and fringe belts. Notice how they divert new streets or preserve old plot patterns. You might also observe the in action within the core, where long medieval plots are first subdivided and built over ('climax'), and later amalgamated for larger developments ('recession'). This detailed, evidence-based approach transforms a flat map into a four-dimensional story of urban transformation.
Effective land development begins with a comprehensive working master plan that integrates goals with diverse land use perspectives.
By following this process, you are no longer just looking at a map. You are reading the landscape and uncovering the historical processes that are physically encoded into the streets, plots, and buildings of the city.