Applied Forex Trading Strategies
Advanced Technical Strategy
Beyond the Basics
Moving past simple trend lines is about learning to read the market's deeper narrative. Professional traders rarely rely on a single signal. Instead, they look for confirmation, a technique where multiple, unrelated indicators point to the same conclusion. This is called convergence, and it’s the cornerstone of building high-confidence trade setups.
Think of it like a detective solving a case. A single clue is intriguing, but it isn't proof. Multiple, independent pieces of evidence all pointing to the same suspect build a much stronger case. In trading, our 'clues' are technical indicators, and when they align, our 'case' for a trade becomes significantly more compelling.
Combining Indicators
Two of the most powerful indicators for this purpose are the Moving Average Convergence Divergence (), which tracks momentum, and the Relative Strength Index (RSI), which measures the speed and change of price movements to identify overbought or oversold conditions.
Let’s say you see a bullish signal on the MACD, where the MACD line crosses above its signal line. By itself, that’s a decent sign. But what if the RSI is also moving up from below 30, indicating the asset is moving out of oversold territory? Now you have convergence. Two different indicators are confirming the potential for an upward move. This alignment significantly increases the probability of a successful trade.
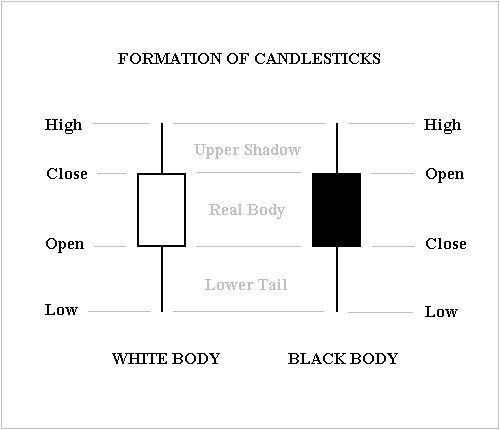
The opposite concept, divergence, is just as powerful. Divergence occurs when the price of an asset is moving in the opposite direction of a technical indicator. For example, if the price chart shows a new high, but the RSI makes a lower high, this is a bearish divergence. It's a warning sign that the momentum behind the price rise is fading and a reversal could be imminent.
Convergence strengthens a trade signal. Divergence warns that a trend's momentum is weakening.
Another essential tool is Bollinger Bands. These are volatility bands placed above and below a moving average. When the bands tighten, it often signals that volatility is low and a period of high volatility could be coming. When they expand, it shows volatility has increased. Traders often watch for prices to touch the outer bands as a signal that the asset is overextended, but this must be confirmed with other indicators.
Advanced Patterns
Candlestick patterns provide a detailed snapshot of market psychology. Beyond single candles, multi-candle patterns offer even more profound insights.
- Engulfing Patterns: A Bullish Engulfing pattern occurs when a small bearish candle is followed by a larger bullish candle that completely 'engulfs' the previous one. It signals a potential bottom. A Bearish Engulfing is the opposite and signals a potential top.
- Three White Soldiers: This pattern consists of three long, consecutive bullish candles, each closing higher than the last. It's a strong sign of a bullish reversal after a downtrend.
- Three Black Crows: The bearish counterpart to the soldiers, this pattern features three long, consecutive bearish candles, signalling a potential reversal of an uptrend.
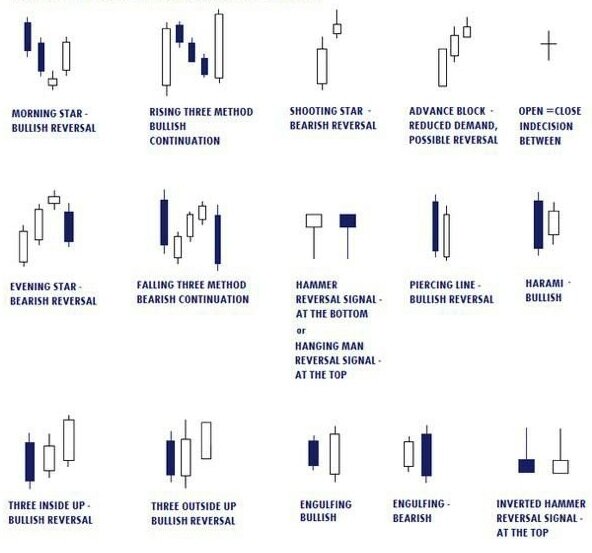
Zooming out, we see larger chart patterns that form over many periods. These patterns, like Head and Shoulders or Triangles, can foreshadow major trend changes or continuations.
- Head and Shoulders: A classic reversal pattern that signals a shift from a bullish to a bearish trend. It consists of three peaks: a central, higher peak (the head) flanked by two lower peaks (the shoulders).
- Triangles (Symmetrical, Ascending, Descending): These are typically continuation patterns. Price action becomes more and more compressed within two converging trendlines before breaking out in the direction of the prior trend.
- Triple Top/Bottom: These are reversal patterns where the price tests a resistance or support level three times before reversing direction. They are considered very strong signals of a trend change.
A final tool for precise entry timing is the Fibonacci retracement. After a significant price move, markets often 'retrace' or pull back a portion of that move before continuing in the original direction. By drawing retracement levels between the swing high and low, traders can identify potential support levels where a pullback might end and the original trend might resume. The most-watched levels are 38.2%, 50%, and 61.8%.
For example, if a currency pair rallies from 1.1000 to 1.1200, a trader might look for a buying opportunity if the price pulls back to the 50% retracement level at 1.1100. Combining this with a bullish engulfing pattern and a MACD crossover at that level would be a powerful convergence signal.
What is the primary purpose of seeking 'convergence' in technical analysis?
If an asset's price chart shows a new high, but the Relative Strength Index (RSI) indicator shows a lower high, what is this phenomenon called?
By layering these tools—indicator convergence, advanced patterns, and retracement levels—you move from simply observing the market to strategically engaging with it. Each tool validates the others, building a more complete picture and enabling more precise, confident execution.