Applied Data Science and Analytics for Professionals
Data Engineering for Economics
From Raw Data to Insight
Economic analysis relies on clean, consistent data. But real-world financial data is rarely pristine. It arrives from different sources, in various formats, and with its own set of rules. A company's quarterly report, a central bank's API feed, and a market data provider's database don't naturally align. Simply loading this data into a spreadsheet isn't enough; you'll be comparing apples to oranges, leading to flawed conclusions.
The bridge from this raw, heterogeneous data to analysis-ready information is data engineering. It’s the process of building an industrialised workflow to systematically clean, standardise, and integrate data. This ensures the accuracy and integrity needed for reliable economic modelling and decision-making.
Advanced Data Cleaning
Beyond correcting simple typos or filling in missing values, financial data presents unique challenges. One of the most common is inconsistent currency formats. A dataset might contain figures in USD, EUR, and JPY, all mixed together. Direct comparison is impossible without standardisation.
To solve this, we convert all monetary values to a single base currency. This typically involves using a reliable source for historical exchange rates and applying them based on the transaction date.
import pandas as pd

# Assume 'df' is a DataFrame with 'Amount' and 'Currency' columns
# and 'exchange_rates' is a DataFrame with daily rates against USD.
df['Date'] = pd.to_datetime(df['Date'])
exchange_rates['Date'] = pd.to_datetime(exchange_rates['Date'])

# Merge dataframes on the date
df_merged = pd.merge(df, exchange_rates, on='Date')

# Standardise amounts to USD
def standardise_currency(row):
    rate = row.get(row['Currency'], 1.0) # Get rate for the currency, default to 1.0 if it's already USD
    return row['Amount'] / rate

df_merged['Amount_USD'] = df_merged.apply(standardise_currency, axis=1)
Another major hurdle is aligning different fiscal calendars. Company A might end its fiscal year in December, while Company B ends theirs in June. Comparing their 'Q4' earnings directly is misleading. You must first align their financial periods to a standard calendar quarter (e.g., Jan-Mar, Apr-Jun) to create a valid basis for comparison. This process often requires careful mapping of each company's reported periods to the correct calendar dates.
Similarly, discrepancies in revenue recognition—when a company records its sales—can distort analysis. One firm might recognise revenue upon signing a contract, another upon delivery. Understanding these accounting nuances is crucial for cleaning the data correctly.
Building an ETL Pipeline
Solving these issues one by one is inefficient. A more robust approach is to automate the entire process using an 'Extract, Transform, Load' (ETL) pipeline. This is a structured workflow for moving data from its source to a final destination, like a data warehouse, where it's ready for analysis.
- Extract: This is the first step, where data is pulled from its various sources. This could be querying a transactional SQL database, hitting a central bank's API for interest rate data, or parsing files from a market data feed.
- Transform: This is where the real work of cleaning and standardisation happens. In this stage, you'd perform the currency conversions, align fiscal periods, handle missing values, and join disparate datasets together.
- Load: Once the data is transformed into a clean, consistent format, it is loaded into a target system. This could be a database optimised for analytical queries, making it easy for economists and analysts to access.
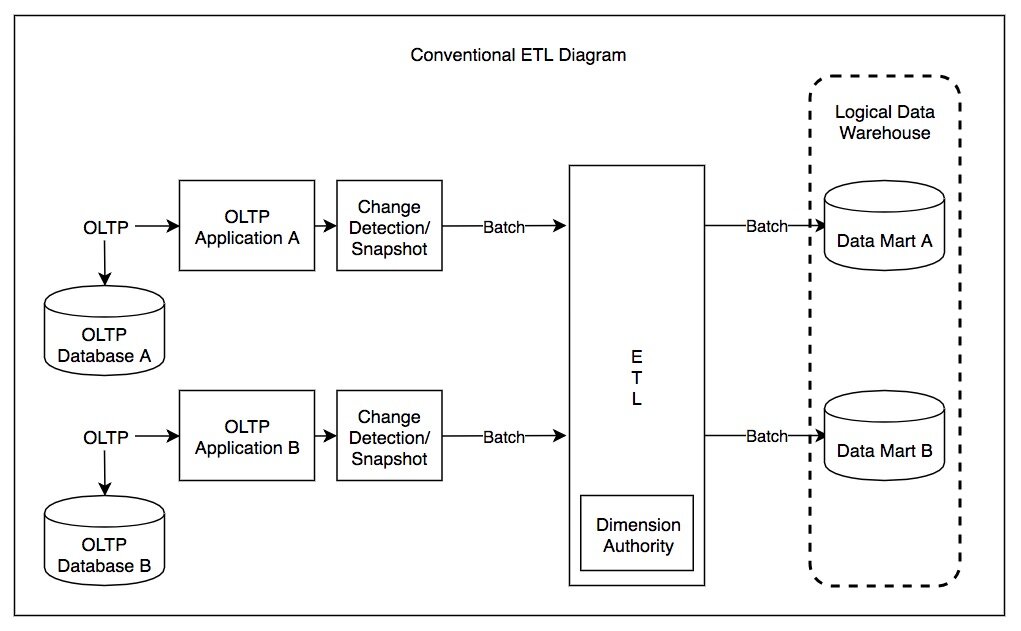
Modern tools like Python's Pandas library and SQL are the workhorses of the ETL process. They provide powerful, flexible ways to handle the complex transformations that economic data requires.
Now, let's test your understanding of these data engineering principles.
What is the primary purpose of building an ETL (Extract, Transform, Load) pipeline in the context of economic analysis?
An analyst is comparing the Q1 performance of two companies. Company A's fiscal year ends in December, while Company B's ends in June. What is the main problem with a direct comparison of their 'Q1' reports?
Building effective data pipelines is a foundational skill. It transforms raw, chaotic data into a reliable asset for generating sound economic insights.