Applied Data Analytics and Insights
Complex Data Wrangling
Wrangling Real-World Data
You've already mastered the fundamentals of data cleaning—handling missing values and basic filtering. Now, we'll tackle the messier, more complex problems that show up in real-world datasets. This involves moving beyond simple checks and using more powerful techniques to prepare data for robust analysis.
Data cleaning and preprocessing are fundamental steps in the data science process.
First, we'll look at data that isn't normally distributed. Many statistical models assume that your data follows a bell curve, but real data often doesn't. It can be skewed, with a long tail on one side.
Taming Skewed Data
Skewness can throw off model performance. When data is skewed, the mean, median, and mode are not aligned, which can violate the assumptions of algorithms like linear regression. To fix this, we can apply mathematical transformations to make the distribution more symmetrical.
A common and simple approach is the log transformation. It's effective for data that is right-skewed (has a long tail to the right).
For more flexibility, we can use a power transformation, like the Box-Cox transformation. This method finds the best exponent (lambda, ) to apply to your data to make it as close to a normal distribution as possible.
import pandas as pd
import numpy as np
from scipy import stats

# Sample skewed data
data = {'income': [25000, 30000, 32000, 35000, 40000, 45000, 250000, 300000]}
df = pd.DataFrame(data)

# Log Transformation
df['log_income'] = np.log(df['income'])

# Box-Cox Transformation
# Note: boxcox returns two values: the transformed data and the optimal lambda
df['boxcox_income'], optimal_lambda = stats.boxcox(df['income'])

print(df)
Finding Unusual Outliers
Simple outliers are easy to spot—a value of 150 in an age column, for instance. But what about outliers that are only strange in combination with other features? An Isolation Forest is a machine learning algorithm designed to detect such anomalies. It works by randomly partitioning the data. The idea is that outliers are easier to 'isolate' from the rest of the data points. Points that require fewer partitions to be isolated are flagged as anomalies.
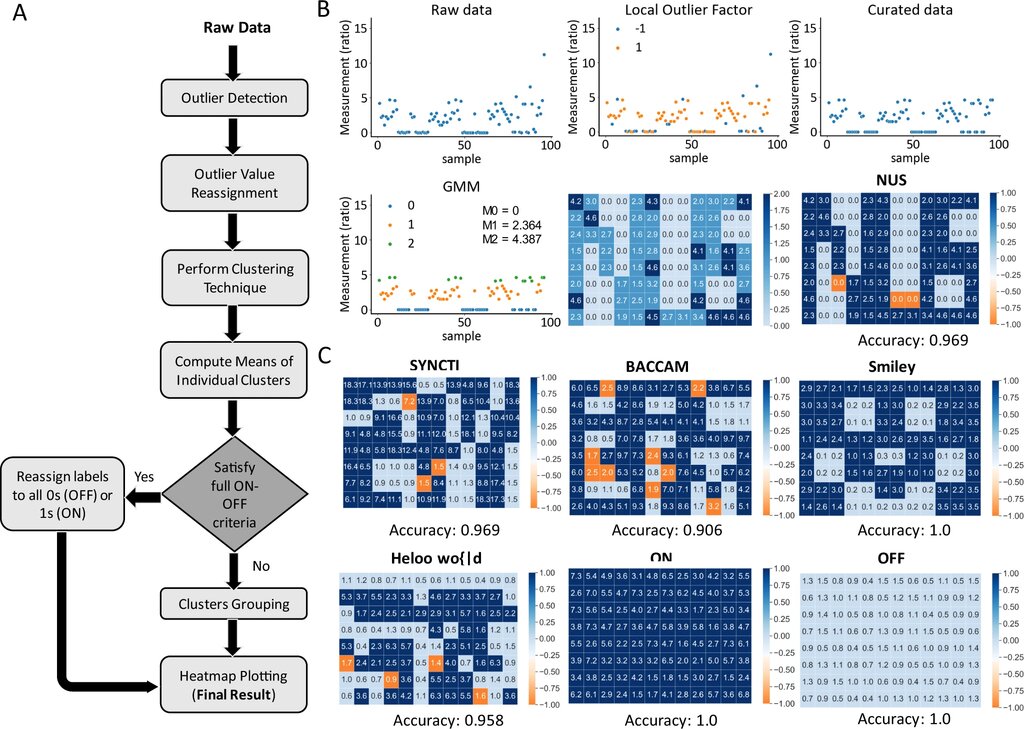
This is particularly useful for identifying multi-modal outliers, which don't stand out on a single dimension but are unusual when you consider several dimensions at once. For example, a person who buys winter coats in July in Miami might be an anomaly that a simple univariate check would miss.
from sklearn.ensemble import IsolationForest
import pandas as pd

# Sample data with a potential outlier
data = {'age': [25, 30, 35, 28, 65, 32],
        'purchases': [5, 6, 8, 4, 1, 7]}
df = pd.DataFrame(data)

# Initialise the model
# Contamination is the expected proportion of outliers
isolation_forest = IsolationForest(contamination=0.1, random_state=42)

# Fit the model and predict
# -1 indicates an outlier, 1 indicates an inlier
df['outlier_flag'] = isolation_forest.fit_predict(df)

print(df)
Advanced Data Cleaning and Shaping
Beyond numbers, text data and data structure present unique challenges. Simple duplicate checks might not be enough, and the format of your data might not be suitable for your analysis.
Sophisticated duplicates aren't exact copies. They're records that refer to the same entity but have slight variations, like a typo in a name or a different address format.
You can resolve these by checking for duplicates across a combination of columns. For example, two customer records might be considered duplicates if their first_name, last_name, and date_of_birth are all identical, even if their email address differs.
import pandas as pd

data = {'first_name': ['Jon', 'Jane', 'Jon', 'Sue'],
        'last_name': ['Smith', 'Doe', 'Smith', 'Kim'],
        'dob': ['1990-01-15', '1985-05-20', '1990-01-15', '1992-11-30'],
        'email': ['jon@email.com', 'jane@email.com', 'jsmith@email.com', 'sue@email.com']}
df = pd.DataFrame(data)

# Identify duplicates based on a subset of columns
duplicates = df.duplicated(subset=['first_name', 'last_name', 'dob'], keep=False)

print("Records identified as duplicates:")
print(df[duplicates])
Text data often needs cleaning with more precision than simple string methods allow. Regular expressions (regex) are a powerful tool for finding and replacing complex patterns in text. You can use them to extract phone numbers, remove special characters, or standardise formatting.
import pandas as pd

data = {'product_id': ['SKU-001-A', 'SKU 002-B', 'SKU:003/C']}
df = pd.DataFrame(data)

# Use regex to extract only the numeric part of the ID
# '\d+' matches one or more digits
df['product_number'] = df['product_id'].str.extract('(\d+)')

print(df)
Finally, sometimes your data isn't in the right shape. Data can be in a 'wide' format, where each observational unit has data in multiple columns, or a 'long' format, where each observation is on its own row. Tidy data principles prefer a long format, which is often easier for analysis and visualisation tools to work with.
Pandas provides two key functions for this: melt() to go from wide to long, and pivot() to go from long to wide.
import pandas as pd

# Wide format data
wide_df = pd.DataFrame({
    'student': ['Alice', 'Bob'],
    'midterm': [85, 90],
    'final': [88, 92]
})

# Melt: Convert from wide to long format
long_df = wide_df.melt(
    id_vars=['student'],
    value_vars=['midterm', 'final'],
    var_name='exam_type',
    value_name='score'
)

print("--- Long Format ---")
print(long_df)

# Pivot: Convert from long back to wide
wide_again_df = long_df.pivot(
    index='student',
    columns='exam_type',
    values='score'
).reset_index()

print("\n--- Wide Format (Pivoted) ---")
print(wide_again_df)
Mastering these advanced wrangling techniques is crucial. They ensure your dataset is not just clean, but structured and conditioned for accurate, insightful analysis, no matter how messy it was to begin with.
Why might a data scientist apply a log transformation to a feature in a dataset?
An analyst is examining a dataset of customer transactions. They suspect fraudulent activity which isn't obvious when looking at single variables (e.g., transaction amount) but might be apparent when combining variables (e.g., a large purchase of winter coats shipped to a tropical location in summer). Which technique is specifically designed to find such anomalies?