Applied Data Analysis Techniques
Clean Messy Data
Wrangling Messy Data
Real-world data is rarely perfect. It arrives with missing values, strange outliers, and logical inconsistencies. Before you can build a predictive model or uncover insights, you must first clean and prepare your dataset. This isn't just a janitorial task; it's a critical stage of analysis that directly impacts the quality of your results.
Data rarely arrives in an analysis-ready state, and the importance of data cleaning is often undervalued.
Let's dive into professional strategies for handling these imperfections, starting with the most common problem: missing values.
The Case of the Missing Data
Missing data points show up as NaN (Not a Number) in Python's Pandas library or NA in R. Finding them is the first step. In Pandas, you can get a quick count of missing values in each column of a DataFrame.
# Assuming 'df' is your Pandas DataFrame
print(df.isnull().sum())
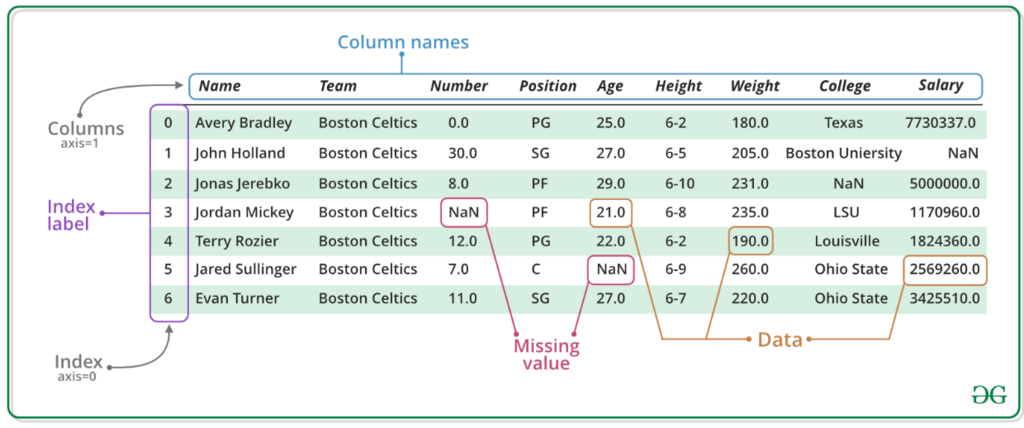
Once you know what's missing, the next question is why it's missing. The reason dictates your strategy. There are three main types of missingness.
| Type | Name | Cause | Example |
|---|---|---|---|
| MCAR | Missing Completely at Random | The missingness has no relationship with any value, observed or missing. It's pure chance. | A survey participant accidentally skips a question. |
| MAR | Missing at Random | The missingness is related to some other observed data, but not the missing value itself. | Men are less likely to fill out a depression survey, so 'depression score' is missing more often for men. The missingness depends on the 'gender' column, which you have. |
| MNAR | Missing Not at Random | The missingness is related to the value that is missing. | People with very high incomes are less likely to report their income. The missingness is related to the income value itself. |
Understanding this distinction is crucial. Deleting all rows with data might be acceptable if the dataset is large. However, doing the same for MAR or MNAR data can introduce serious bias into your analysis, as you would be systematically removing a specific subgroup from your data.
To Delete or To Fill
When you can't just delete rows, you need to fill, or impute, the missing values. This is the process of substituting missing data with estimated values.
impute
verb
To substitute missing data with estimated or calculated values.
The simplest methods involve filling with a measure of central tendency. You can replace missing values in a column with its mean, median, or mode. The choice matters.
- Mean: Good for normally distributed data without outliers.
- Median: Better for skewed data or data with significant outliers, as it's less affected by extreme values.
- Mode: The only choice for categorical (non-numeric) data.
More sophisticated methods consider the data's structure. Forward-fill (ffill) and backward-fill (bfill) are useful for time-series data, where a missing value is likely to be similar to the one that came just before or after it.
# Mean imputation for 'age' column
df['age'].fillna(df['age'].mean(), inplace=True)

# Median imputation for 'income' column
df['income'].fillna(df['income'].median(), inplace=True)

# Forward-fill for a time-series column
df['stock_price'].ffill(inplace=True)
For even more accuracy, you can use predictive imputation. The (KNN) algorithm finds the 'k' most similar data points (the "neighbors") in your dataset and uses their values to estimate the missing one. For a missing income value, KNN might average the incomes of other individuals with similar age, education, and job title. This is computationally more expensive but often yields much better results than simple imputation.
Dealing with Outliers
Outliers are data points that are abnormally distant from other values. They can be legitimate data points (e.g., a CEO's salary in a company-wide dataset) or errors (e.g., a human height of 9 feet). Two common statistical methods for detecting them are the Interquartile Range (IQR) and Z-scores.
The IQR method defines outliers as any value that falls outside the range of and .
The tells you how many standard deviations a data point is from the mean. A common rule of thumb is to classify any point with a Z-score greater than 3 or less than -3 as an outlier.
Finally, beyond statistical checks, apply common sense. Are there ages listed as 200? Negative values for height? These logical errors must be corrected, often by treating them as missing data and applying an appropriate imputation strategy. Cleaning data is a mix of science and detective work, ensuring the foundation of your analysis is solid and trustworthy.
Time to check your understanding of these data cleaning techniques.
What is the process of substituting missing data with estimated values called?
You are cleaning a dataset of house prices in a neighborhood. One house is a massive mansion, making its price a significant outlier. If you need to fill in a missing price for a different, standard-sized house, which measure is best for imputation?
By mastering these techniques, you can transform messy, real-world data into a clean, reliable resource ready for analysis and modeling.