AI GEO AEo Data Analytics
Introduction to Geospatial Data
What Is Geospatial Data?
Geospatial data is simply information with a geographic location attached to it. Think about the weather app on your phone. It doesn't just tell you it's 72°F; it tells you it's 72°F right where you are. That connection between information (the temperature) and a location (your spot on Earth) is what makes it geospatial.
This kind of data powers many of the tools we use daily, from navigation apps that find the quickest route to work, to services that recommend restaurants near you. It answers the fundamental question: "Where?" By linking data to a specific place, we can uncover patterns, relationships, and trends that would otherwise be invisible.
At its core, geospatial data turns simple information into a map, allowing us to see our world in layers.
The Two Flavors of Data
Geospatial data comes in two main types: vector and raster. They represent the world in fundamentally different ways, each with its own strengths.
Vector
noun
A coordinate-based data model that represents geographic features as points, lines, and polygons.
Vector data is like a connect-the-dots drawing. It uses precise x, y coordinates to define discrete objects.
- Points represent single locations, like a fire hydrant, a specific address, or a single tree.
- Lines (or polylines) represent linear features. Think of rivers, roads, or subway routes.
- Polygons are enclosed shapes that represent areas, such as a country's border, a lake's shoreline, or a national park.
Vector data is excellent for showing features with clear boundaries. Because it's based on mathematical coordinates, it can be scaled up or down without losing detail.
Raster
noun
A data model that uses a grid of cells, or pixels, to represent continuous phenomena like elevation or temperature.
If vector data is a drawing, raster data is a photograph or a mosaic. It's a grid of cells, much like the pixels on your computer screen. Each cell in the grid contains a value representing some characteristic, like temperature, elevation, or a specific color in a satellite photo.
Think of a satellite image of a forest. It’s a raster file. If you zoom in far enough, you'll see the individual pixels, each with its own color value that, when viewed together, creates the image of the forest. This format is perfect for representing data that changes continuously across a landscape, without abrupt borders.
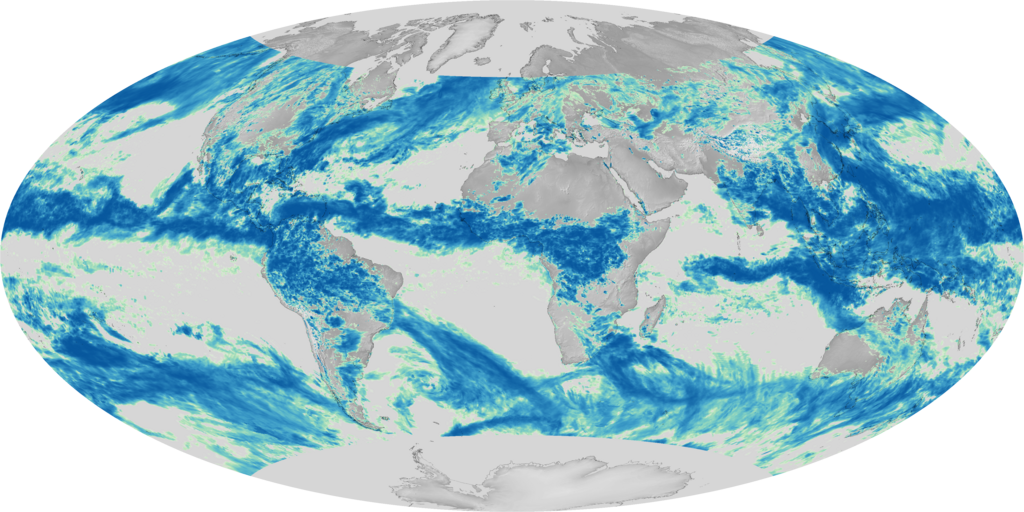
Here is a simple way to visualize the difference:
| Feature | Vector Data | Raster Data |
|---|---|---|
| Structure | Points, lines, polygons | Grid of cells (pixels) |
| Best for | Discrete objects (roads, buildings) | Continuous data (elevation, temperature) |
| Example | A map of city streets | A satellite photograph |
| Scalability | Scales smoothly | Can become pixelated |
| File Size | Generally smaller | Often larger |
Where Data Meets the Map
So we have this data, but how does a computer know where to put it on a map of the Earth? That’s the job of coordinate systems and map projections.
A coordinate system is a framework for defining locations. The most common one is the geographic coordinate system, which uses latitude and longitude to pinpoint any location on Earth's curved surface. Latitude lines run east-west, measuring distance north or south of the equator. Longitude lines run north-south, measuring distance east or west of the prime meridian.
But there's a problem. The Earth is a sphere, and our screens and maps are flat. A map projection is a mathematical method for transferring information from the Earth's curved surface onto a flat plane. Every projection distorts something, whether it's area, shape, distance, or direction. There's no single perfect projection.
The famous Mercator projection, for example, preserves direction and is great for navigation. However, it drastically distorts the size of landmasses near the poles. Greenland looks as large as Africa, but is actually 14 times smaller. Other projections try to preserve area or shape, but they introduce other distortions. Choosing the right projection depends entirely on what you want to show with your map.
Putting It All Together with GIS
How do we work with all this data? That's where Geographic Information Systems (GIS) come in.
Geographic Information Systems (GIS) are computer-based tools for capturing, storing, analyzing, and visualizing spatial data
A GIS is software that lets us see, understand, question, interpret, and visualize data in ways that reveal relationships, patterns, and trends. Think of it like a set of digital layers. The bottom layer might be a satellite image of a city (raster data). On top of that, you could add a layer of streets (vector lines), then a layer of building footprints (vector polygons), and then a layer of fire hydrants (vector points).
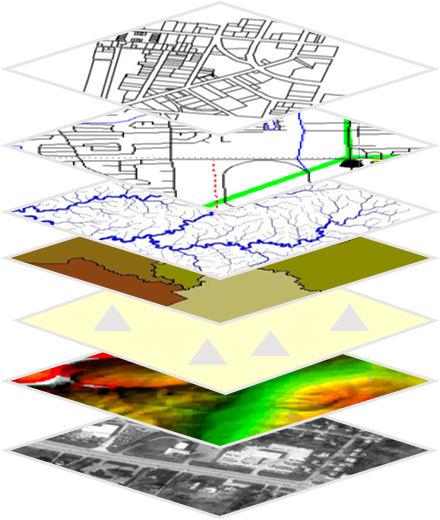
By combining these layers, a city planner could analyze which neighborhoods have poor access to fire hydrants, or an emergency responder could plan the fastest route to a call. GIS is the engine that connects all these different pieces of geospatial information, turning raw data into powerful insights.
What are the two main types of geospatial data?
Which of the following would be best represented using raster data?
Understanding these core concepts, from data types to the tools that manage them, is the first step in harnessing the power of location.