Advanced Trading Dashboard Design
Dashboard Fundamentals
Your Trading Command Center
A trading dashboard is your personal command center for the financial markets. Instead of jumping between different websites, apps, and news feeds, a dashboard brings all the critical information you need into a single, organized view. Think of it like a pilot's cockpit. Everything necessary to fly the plane is within reach, allowing for quick checks and immediate action.
Its purpose is to turn a firehose of market data into clear, actionable insights. In a world where prices change in milliseconds, being able to see the complete picture at a glance is a significant advantage. A well-designed dashboard cuts through the noise and helps you make smarter decisions, faster.
A great dashboard design helps transform complex data into meaningful insights, enabling businesses to track performance, identify trends, and make informed decisions—all at a glance.
The Building Blocks
Effective dashboards are built from a few core components that work together. Understanding them helps you appreciate what makes a dashboard powerful.
Widget
noun
A self-contained module or window within a dashboard that displays a specific piece of information, such as a chart, news feed, or order form.
The foundation is the real-time data feed. This is the lifeblood of your dashboard, streaming live prices, trading volumes, and breaking news. In trading, stale information is useless, so a direct and fast connection to market data is non-negotiable.
Next are the widgets. These are the customizable blocks you use to build your layout. One widget might show a candlestick chart for Apple, another might display your current portfolio performance, and a third could be an order entry window. You mix and match these widgets to create a view tailored to your needs.
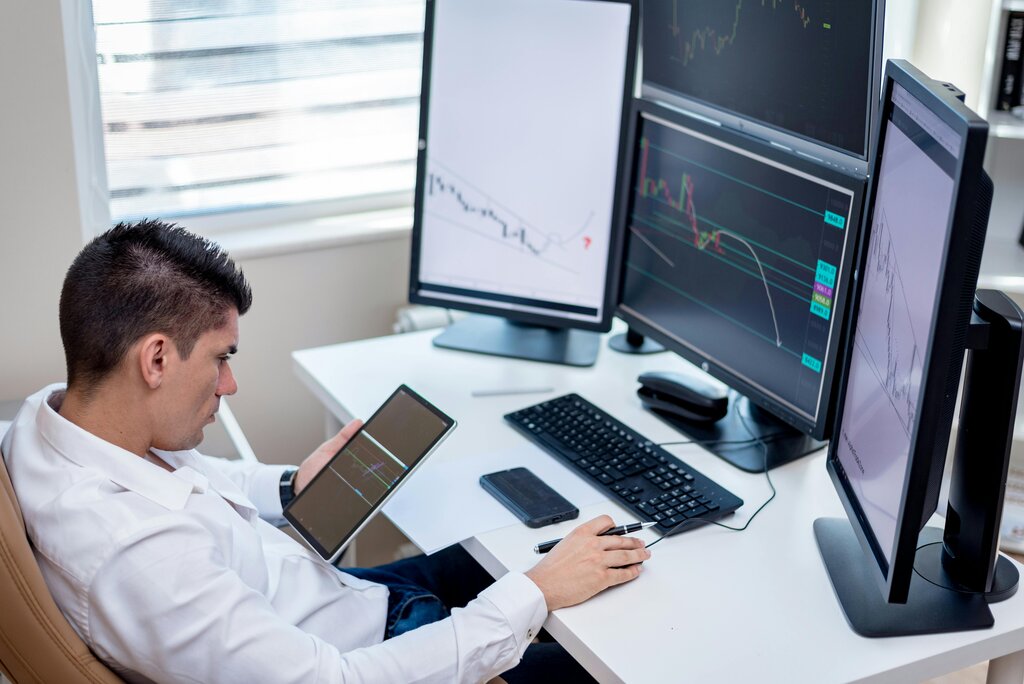
Finally, all of this is held together by the user interface (UI). The best dashboards are clean, intuitive, and easy to read. A cluttered or confusing interface defeats the purpose by creating stress instead of clarity. The goal is to absorb complex information quickly, not to solve a puzzle just to figure out what you're looking at.
Making It Your Own
There is no single "best" dashboard layout. The most effective setup is one that's customized for your specific trading style and goals. What's essential for a day trader who is in and out of positions in minutes is very different from what a long-term investor needs.
A day trader, for example, might prioritize a 1-minute chart, Level 2 order book data showing real-time bids and asks, and a news feed that streams headlines instantly. Their goal is to react to short-term market movements.
Conversely, a swing trader holding positions for days or weeks might focus on a daily chart, key technical indicators like moving averages, and a calendar of upcoming economic events. Their dashboard is built for analyzing broader trends, not split-second changes.
Your dashboard should reflect how you think and trade. Customization transforms a generic tool into a personalized weapon for navigating the markets.
By thoughtfully selecting and arranging your widgets, you create a workflow that supports your strategy. This integration of data allows for more comprehensive analysis. You can see how a news event impacts price action on your chart, and how that price action affects the value of your portfolio, all without ever leaving the screen.
Ready to test your understanding of these core concepts? This quiz will cover the purpose, components, and importance of customization for trading dashboards.
What is the primary purpose of a trading dashboard?
Which component is described as the 'lifeblood' of a trading dashboard, without which the information would be useless?
Ultimately, a dashboard is a tool for clarity. It brings order to the chaotic world of market data, helping you focus on what truly matters to your strategy.