Advanced Stock Trading Mastery
Advanced Chart Patterns
Reading Between the Lines
Basic patterns like the hammer or engulfing candle are the alphabet of chart reading. Now, we move on to reading words and sentences. Advanced patterns are conversations between buyers and sellers, stories of momentum, indecision, and potential reversals told over several price bars.
These more complex patterns give a clearer picture because they represent a more developed struggle in the market. A single candle can be noise; a three-candle formation tells a story.
Consider the Morning Star: A large bearish candle is followed by a small-bodied candle (or doji) that gaps down, and then a third large bullish candle that closes well into the body of the first candle. This pattern shows a potential bottom. Sellers were in full control, then paused with indecision, and finally, buyers took over with force.
The opposite is the Evening Star, signaling a potential top. Other key multi-candle patterns include:
- Three Black Crows: Three consecutive long bearish candles that close progressively lower. A strong reversal signal suggesting sellers have seized control.
- Piercing Line: A two-candle bullish reversal pattern. After a strong down day (a red candle), the next day opens lower but closes above the midpoint of the first day's candle body. It shows buyers are stepping in aggressively.
- Dark Cloud Cover: The bearish counterpart to the Piercing Line. After a strong green candle, the next day opens higher but closes below the midpoint of the first candle's body.
Broader Chart Formations
Zooming out, we see larger patterns formed over weeks or months. These structures give clues about the next major move. A classic bullish continuation pattern is the Cup and Handle, where a rounding bottom (the cup) is followed by a minor pullback (the handle) before the price breaks out to the upside. The handle is a crucial period of consolidation before the next leg up.
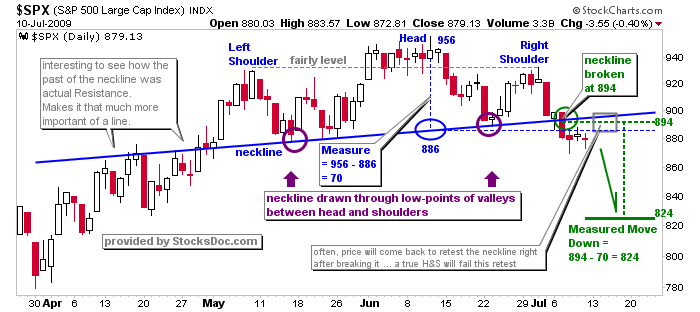
Other major patterns signal reversals. The Head and Shoulders pattern marks a potential trend top. It consists of three peaks: a central 'head' that is higher than the two surrounding 'shoulders'. The pattern is confirmed when the price breaks below the 'neckline', a support level connecting the lows between the peaks. An Inverse Head and Shoulders is the bullish version that signals a potential bottom.
We also see Double and Triple Tops/Bottoms. These are strong reversal signals where the price fails two or three times to break through a key resistance (tops) or support (bottoms) level. Confirmation of a double top requires a break below the low point between the two peaks.
| Pattern | Type | What it Signals |
|---|---|---|
| Flag | Continuation | A brief pause (a rectangular consolidation) in a strong trend. |
| Pennant | Continuation | Similar to a flag, but the pause forms a small, symmetrical triangle. |
| Wedge | Reversal/Continuation | A converging price range. A rising wedge is bearish; a falling wedge is bullish. |
| Triangle | Continuation | A sideways consolidation. Can be symmetrical, ascending (bullish), or descending (bearish). |
Mind the Gap
Gaps are areas on a chart where no trading took place. An asset's price opens significantly higher or lower than the previous day's close, leaving a void. Understanding the type of gap is crucial.
- Breakout Gaps occur when the price moves out of a trading range, often signaling the start of a new trend.
- Runaway (or Measuring) Gaps happen in the middle of a strong trend, representing continued conviction from traders.
- Exhaustion Gaps appear near the end of a trend, signaling a final push before the reversal.
The most important rule in pattern trading: price patterns must be confirmed by volume.
Volume measures the conviction behind a price move. A breakout from a triangle pattern on low volume is likely to fail. It's a 'fakeout'. A true breakout happens on a surge of volume, showing that a large number of participants are driving the move. For a reversal pattern like a Head and Shoulders, you typically want to see volume diminish on the right shoulder compared to the left, indicating that the buying pressure is fading before the breakdown.
Always analyze volume alongside the pattern. Price tells you what is happening, but volume tells you how much conviction is behind it. Ignoring volume is like listening to a story with the sound turned off. You see the action, but you miss the emotion and intent that give it meaning.
Time to test your knowledge of these advanced patterns.
Which of the following patterns consists of three consecutive long bearish candles that close progressively lower, signaling a strong potential reversal to the downside?
After a strong uptrend, a price chart forms three peaks: a central peak that is higher than the two surrounding peaks. What is this classic bearish reversal pattern called?
Recognizing these advanced patterns gives you a significant edge. It allows you to anticipate major market turns and continuations, moving beyond simple signals to understand the deeper market psychology at play.