Advanced Stock Charting and Technical Analysis
Advanced Candlestick Dynamics
Reading the Market's Mind
You already know what a candlestick is. It shows the open, high, low, and close for a given period. But that's just the grammar. To truly understand the market, you need to read the story these candles are telling—a story of fear, greed, and indecision.
The real insight isn't just in the body, but in the wicks, or shadows. A long upper wick on a candle shows that buyers tried to push the price higher, but sellers overwhelmed them and forced it back down. It's a tale of rejection. A long lower wick tells the opposite story: sellers tried to tank the price, but buyers stepped in with force, showing strong support. The size of the body reveals conviction. A large green body shows buyers were in control from start to finish. A large red body shows the sellers dominated.
Think of it like this: the body is the main plot, and the wicks are the dramatic twists. A small body with long wicks on both sides is pure indecision—a battle where neither side could claim victory.
Patterns in Conversation
A single candlestick is a word. A sequence of them is a sentence. Complex patterns, formed by two or three candles, offer much deeper insights into market psychology. These patterns often signal a potential reversal of the current trend, especially when they appear at key levels.
The Bullish Engulfing pattern is a classic example. It occurs after a downtrend and consists of two candles. The first is a small bearish (red) candle, followed by a large bullish (green) candle whose body completely engulfs the previous candle's body. This pattern shows a dramatic shift in momentum. Sellers were in control, but then buyers stepped in with such force that they not only erased the previous period's losses but also pushed prices significantly higher. It’s a sign that the bulls have taken over.
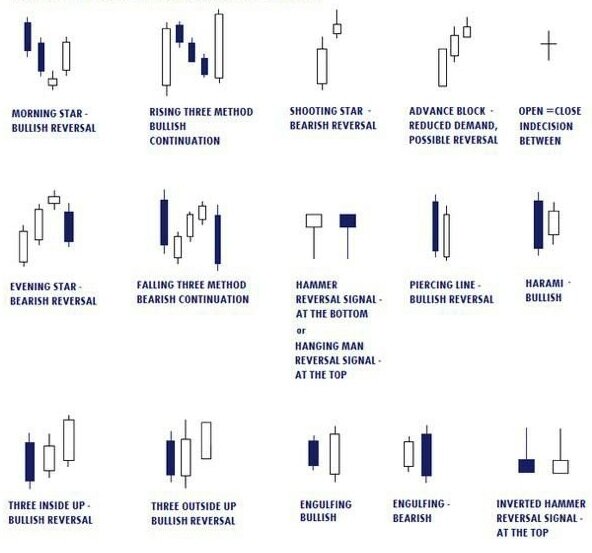
Conversely, the Bearish Engulfing pattern signals a potential top. After an uptrend, a small bullish candle is followed by a large bearish candle that swallows it. This indicates that buying pressure has fizzled out and sellers have seized control with overwhelming force. Another key pattern is the , which is essentially the opposite of an engulfing pattern. It consists of a large candle followed by a small candle whose body is contained within the prior candle's body. It signals a loss of momentum and potential reversal.
| Pattern Name | Type | Description |
|---|---|---|
| Engulfing | Reversal | A large candle's body completely covers the prior small candle's body. Bullish or bearish. |
| Harami | Reversal | A small candle's body is contained within the prior large candle's body. Signals slowing momentum. |
| Morning Star | Bullish Reversal | A large red candle, a small-bodied candle, then a large green candle. Indicates a bottom. |
| Evening Star | Bearish Reversal | A large green candle, a small-bodied candle, then a large red candle. Indicates a top. |
Context Is King
Context matters tremendously in pattern trading – the same candlestick formation can have completely different implications depending on where it appears in relation to trends and support/resistance levels.
A perfect-looking pattern is meaningless in the wrong location. An Evening Star pattern appearing in the middle of a choppy, sideways market doesn't carry much weight. But an Evening Star that forms right at a major resistance level after a long uptrend is a powerful signal that the rally might be over. The location validates the pattern.
Always analyze candlestick signals within the broader market structure. Are you in an uptrend or a downtrend? Are you approaching a historical support or resistance zone? A reversal pattern that aligns with a key technical level is far more reliable than one that appears in a vacuum. A failed pattern can be just as informative. If a Bullish Engulfing pattern forms at support but the price immediately falls, it tells you the selling pressure is even stronger than anticipated.
Volume is the final, crucial piece of the puzzle. It measures the conviction behind a price move. A reversal pattern that occurs on high, spiking volume is significantly more credible than one that forms on low, anemic volume. High volume confirms that a large number of participants are driving the new move. Low volume suggests a lack of interest, making the pattern more likely to fail.
This is the essence of (VSA). By analyzing the candle's price range (spread), its closing price, and the volume traded, you can gain insight into the balance between supply and demand. For example, a wide-spread bullish candle closing on its high with massive volume suggests strong buying demand. A narrow-spread candle with high volume, however, could signal that a lot of effort is being exerted for very little price movement, possibly indicating that a trend is exhausting itself.
You observe a single candlestick with a small body and a very long upper wick at the top of an uptrend. What is the most likely interpretation?
Which of the following best describes a Bullish Engulfing pattern?
By moving beyond simple pattern identification and incorporating context and volume, you can start to read the subtle language of the market and make more informed decisions.